How to create Analytics & Reports?
- Only Admins have the authority to create new analytics in Wavity platform.
- To begin, click on "Design Tools" as shown in below image.
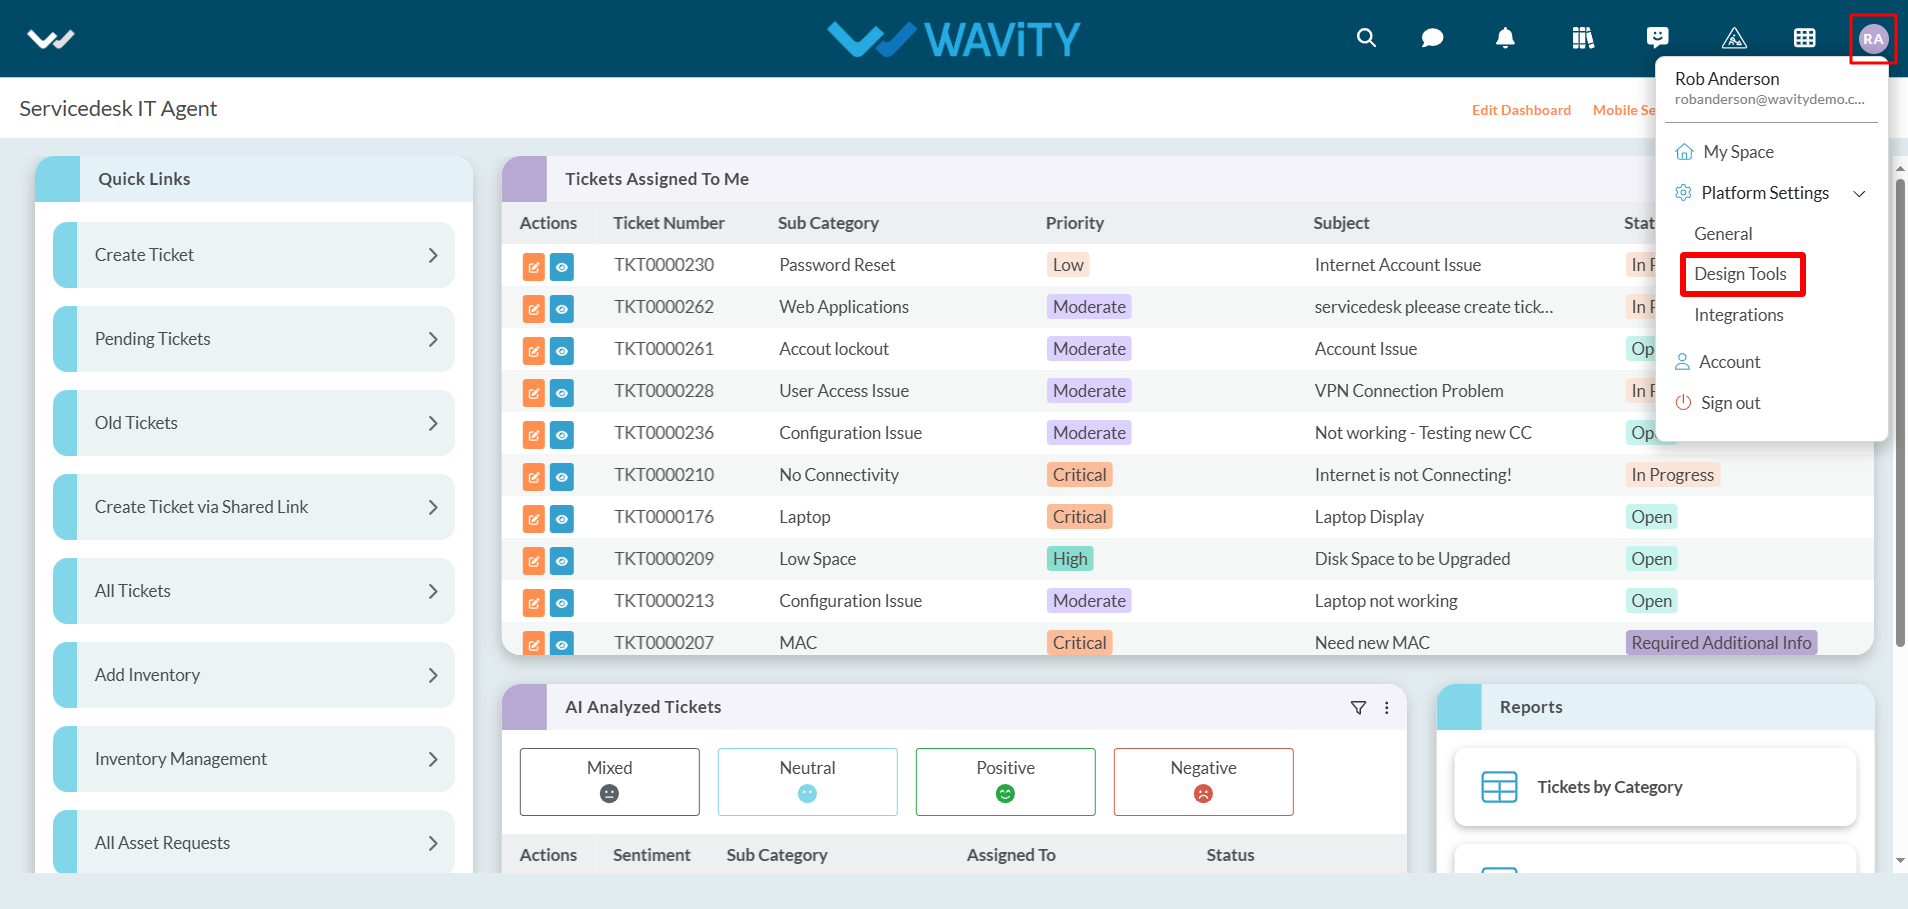
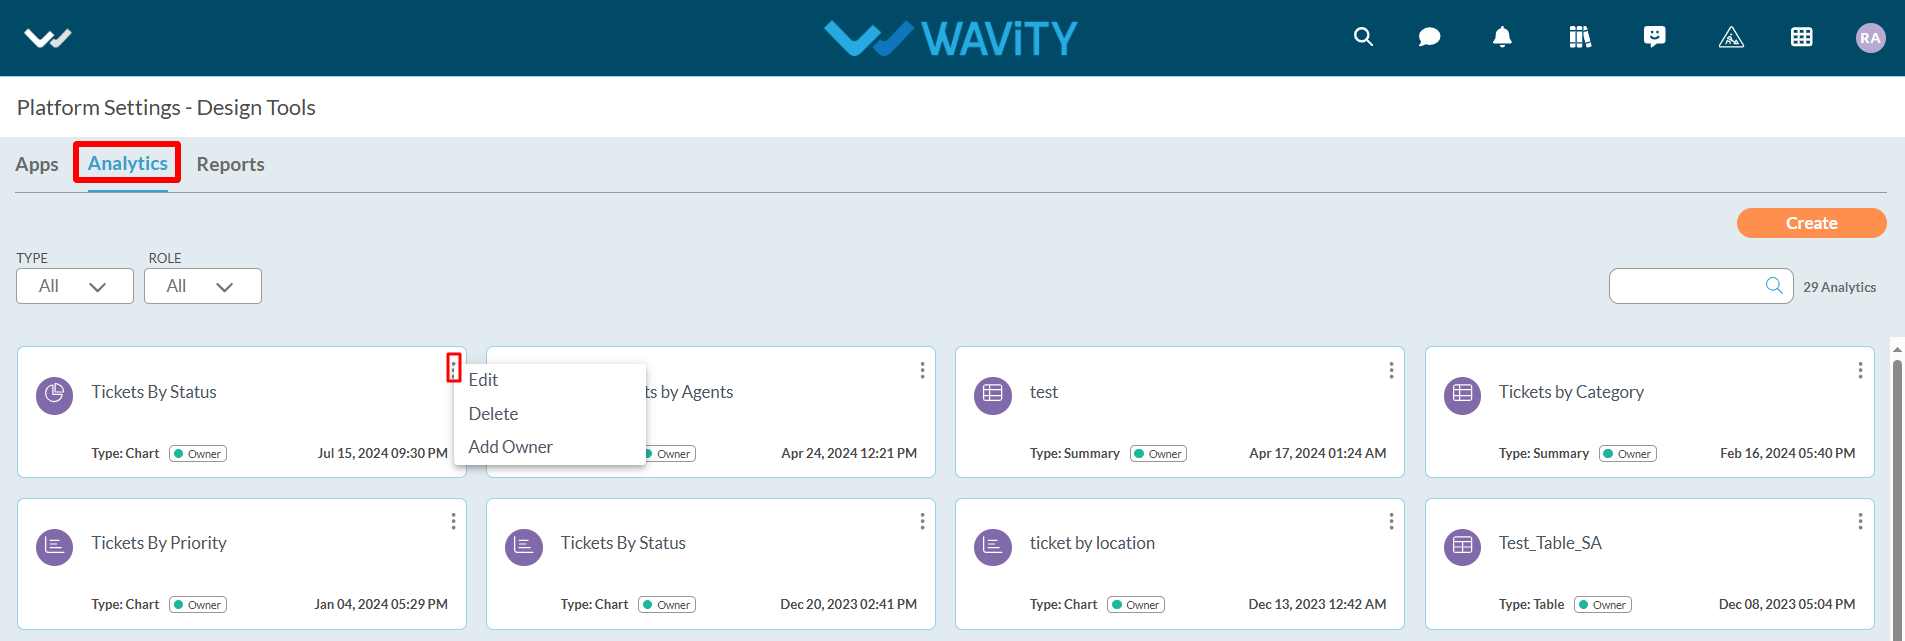
- In “Analytics” section, All the existing analytics of the platform will be displayed for the admin.
- Click on the "3 dots" icon to perform various functions for existing analytics, such as editing, deleting, or adding an owner, as shown below.
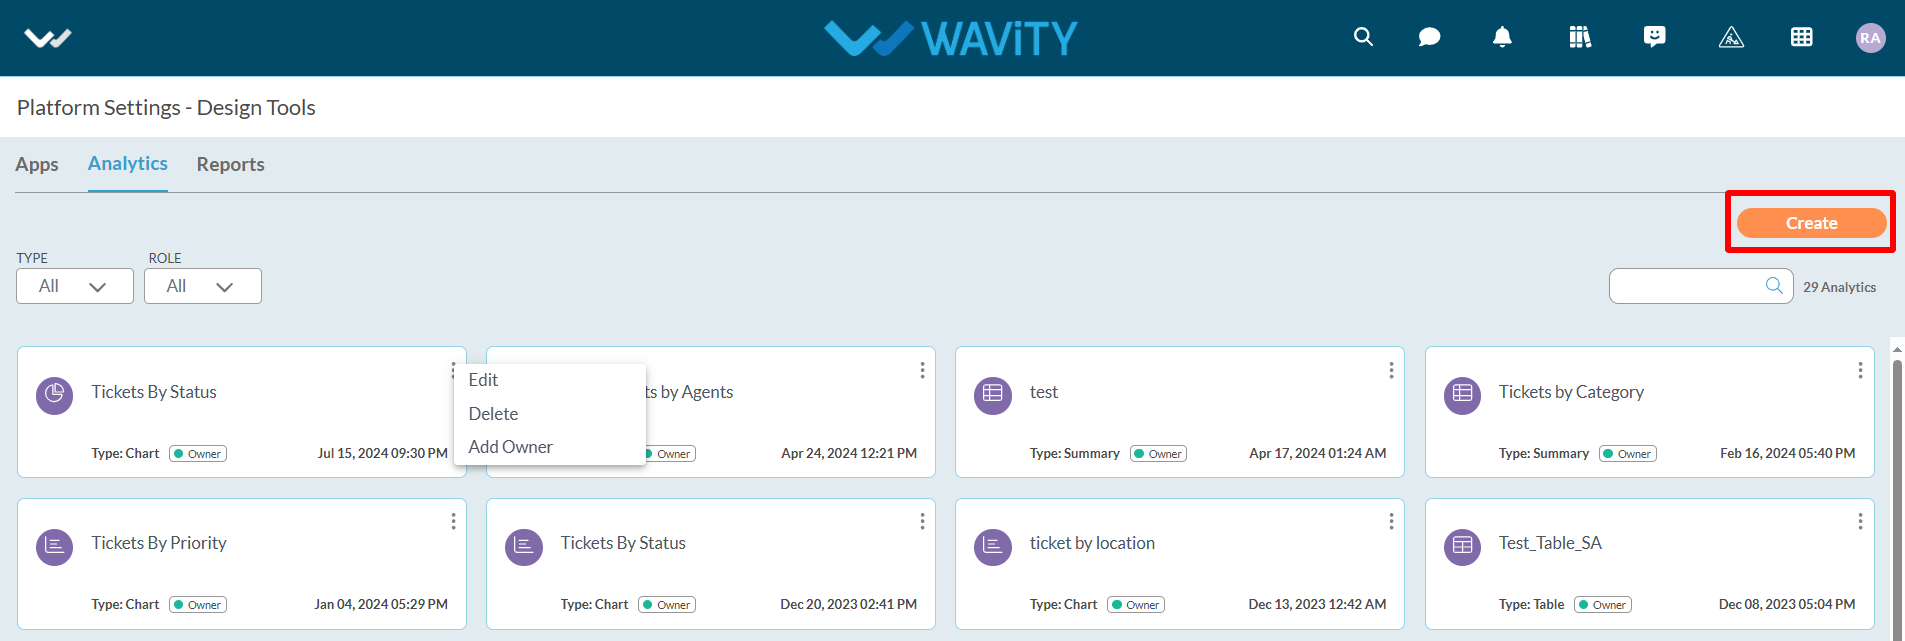
- To create a new Analytic: Click on “Create” button as shown below.
- Provide details such as the Title and Description of the analytics for future reference.
- Additionally, specify the users who will have owner access. You can also add users or groups who will have view-only access to the analytics.
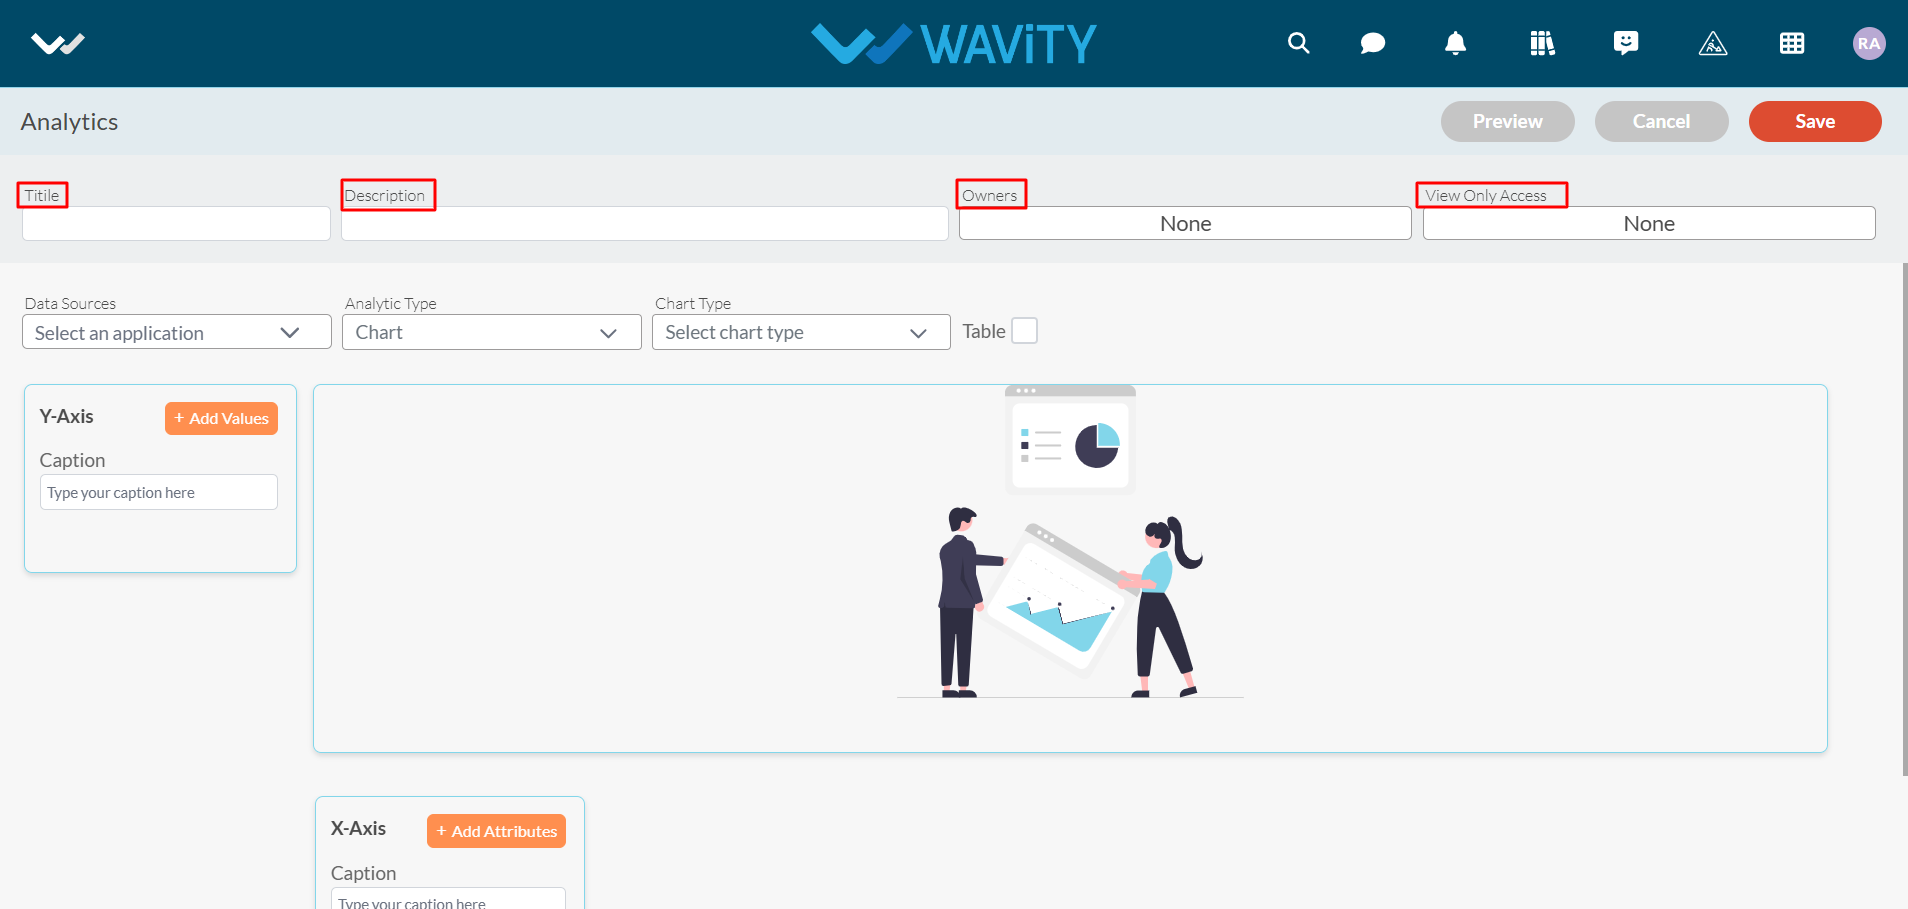
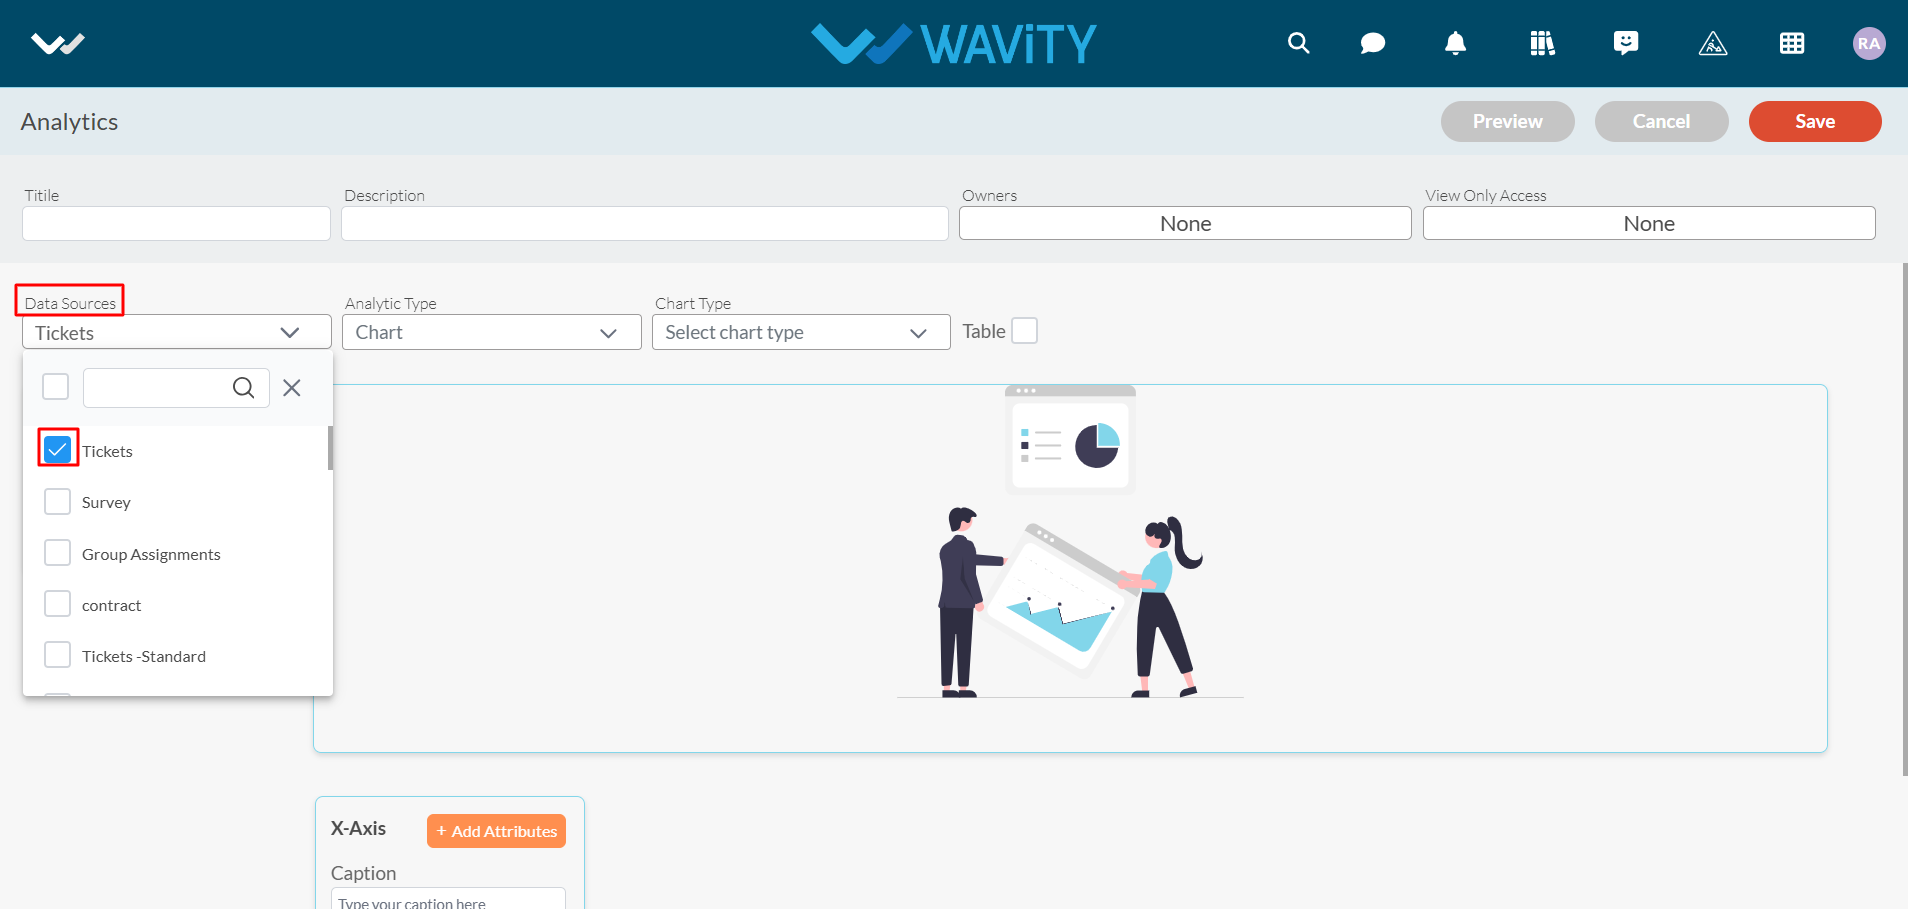
- Select the Data Source Application (From which you can add attributes & values in X & Y axis to generate analytics & reports based on your requirement).
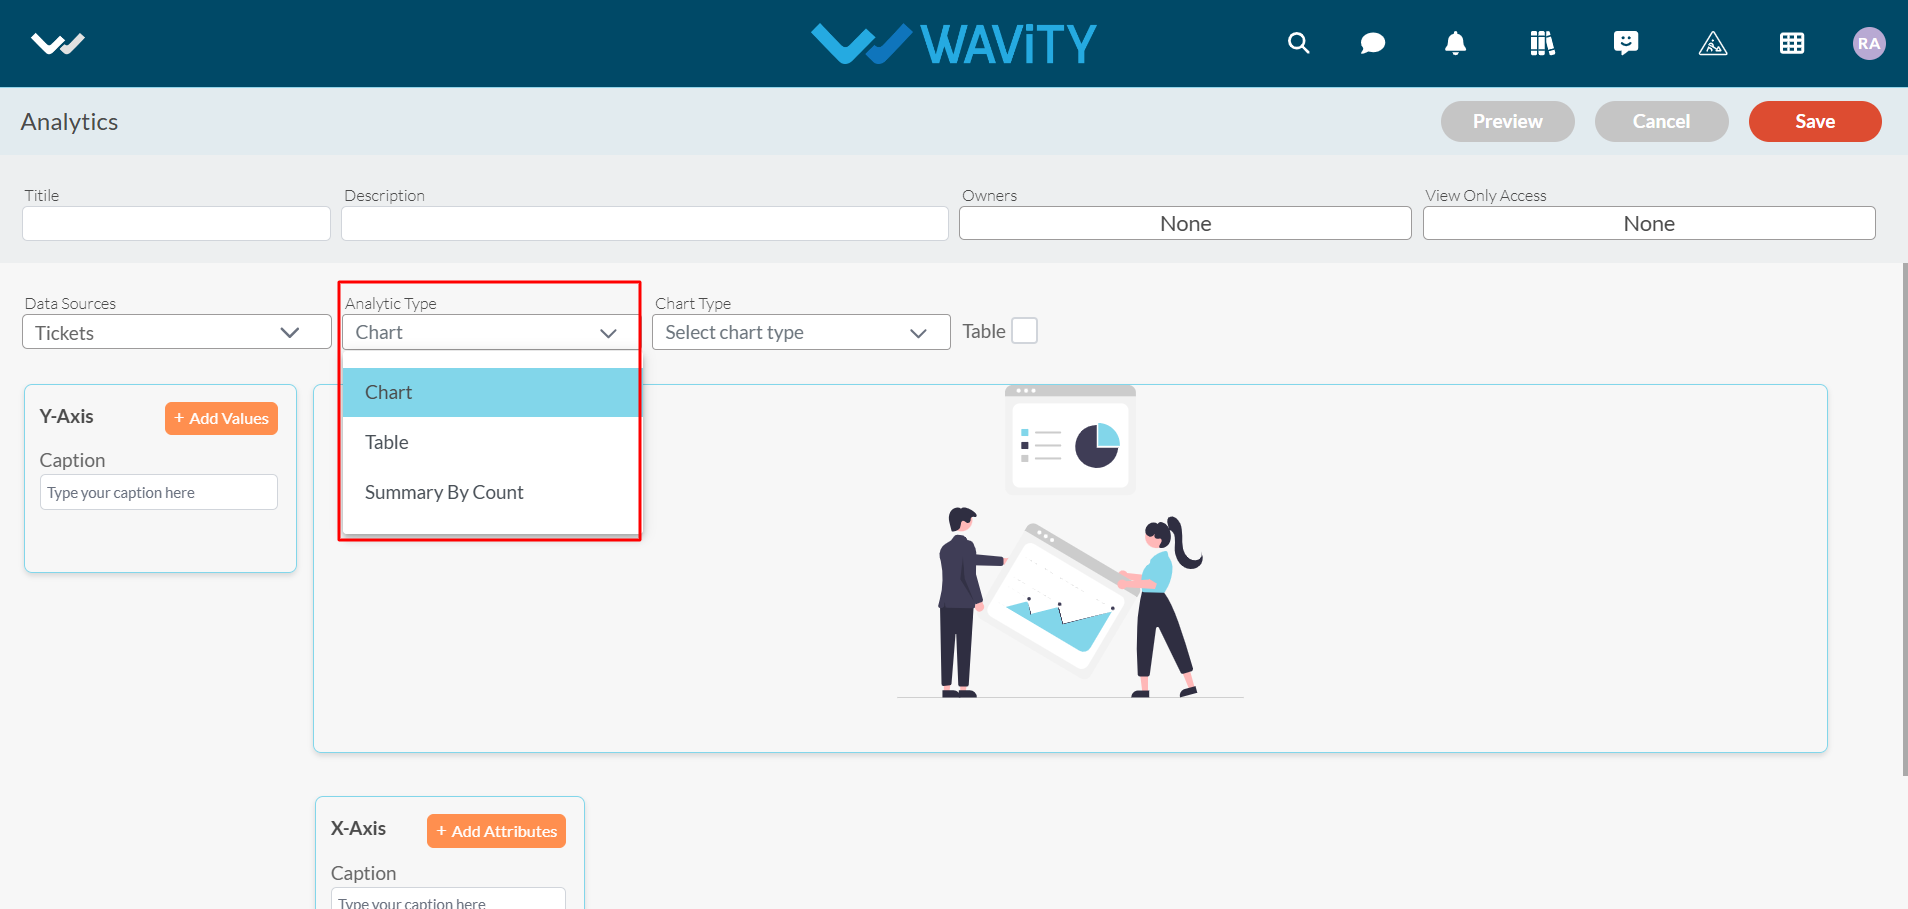
- You can select the Analytic type from the dropdown as shown in below image.
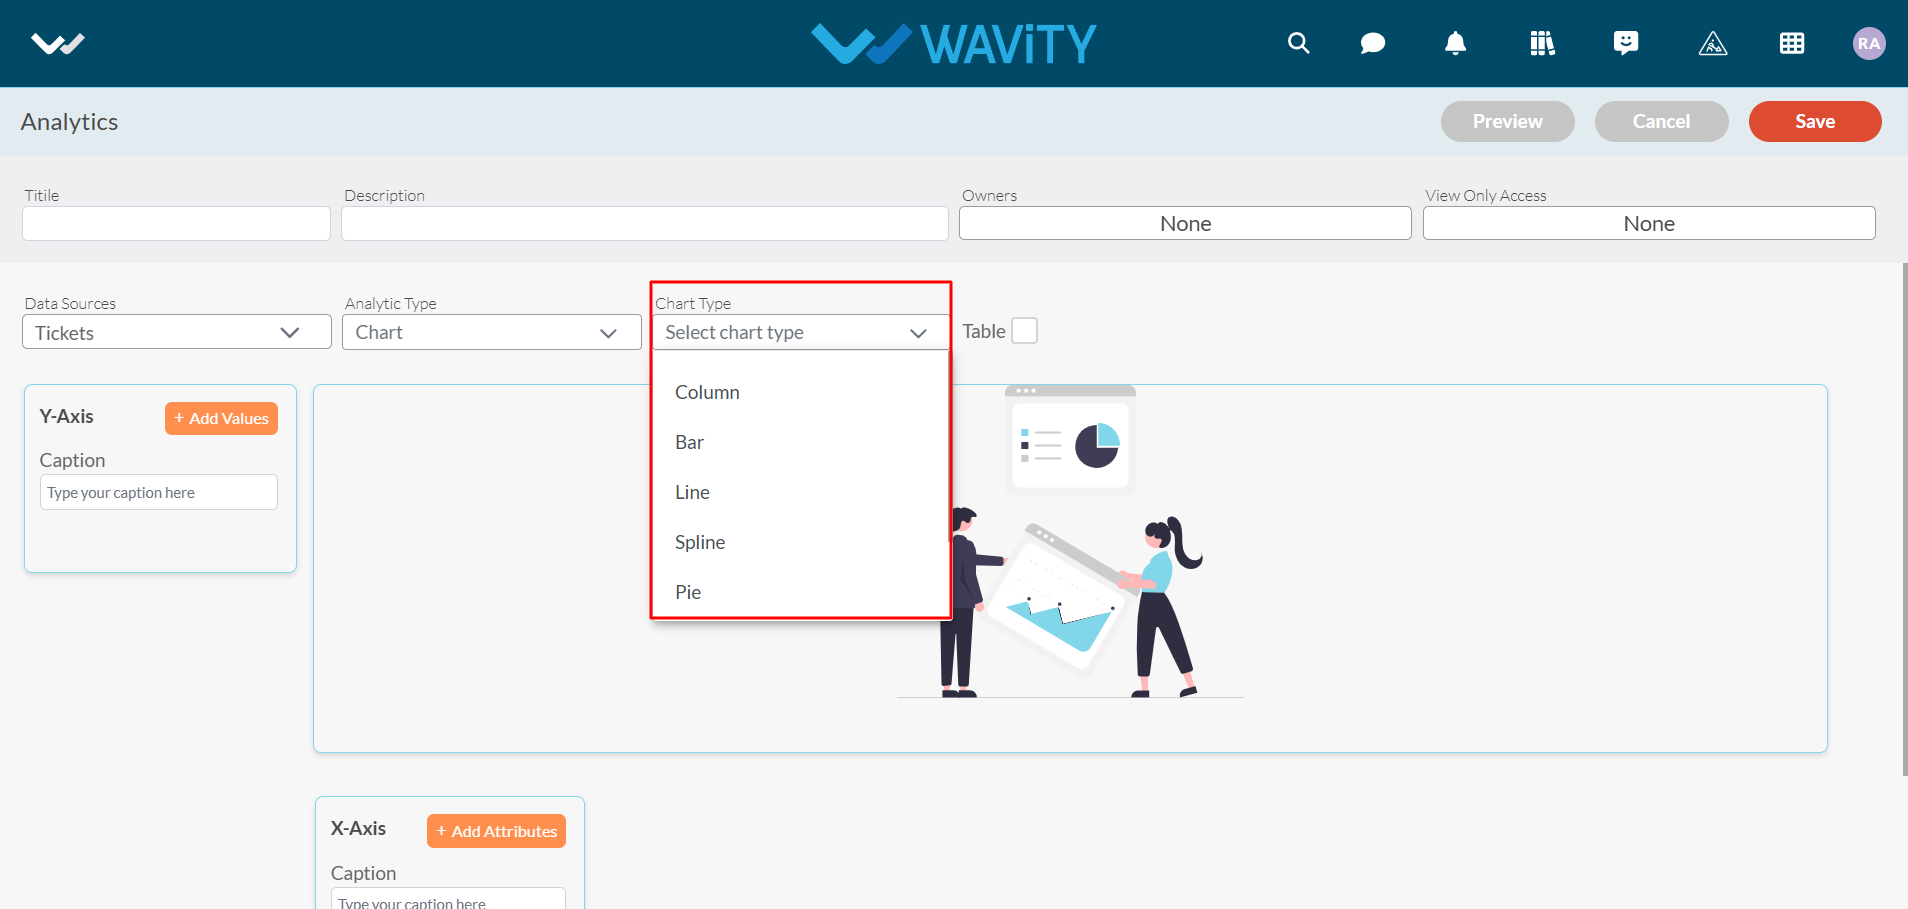
- Upon selecting 'Chart' as the Analytic type, choose the desired chart visualization type from the dropdown menu, as shown in the image below.
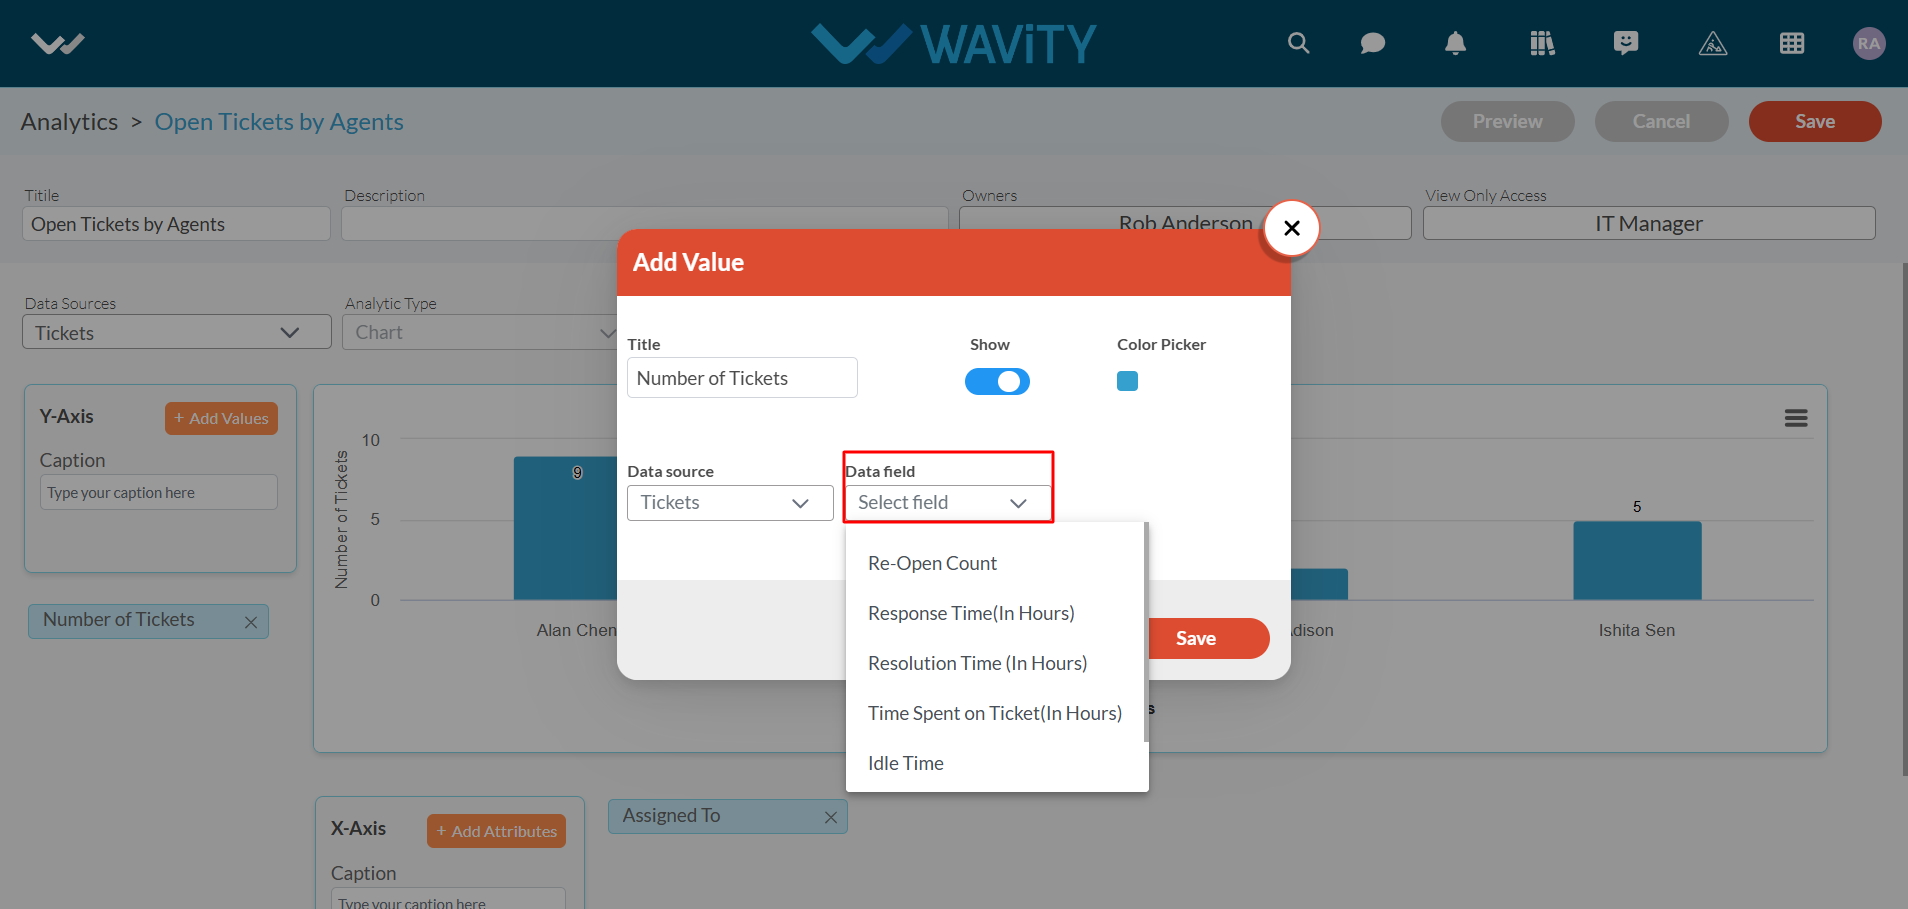
- Now, you can “Add Values” and “Add Attributes” into Y-axis and X-axis to generate an Analytics based on the data in the platform.
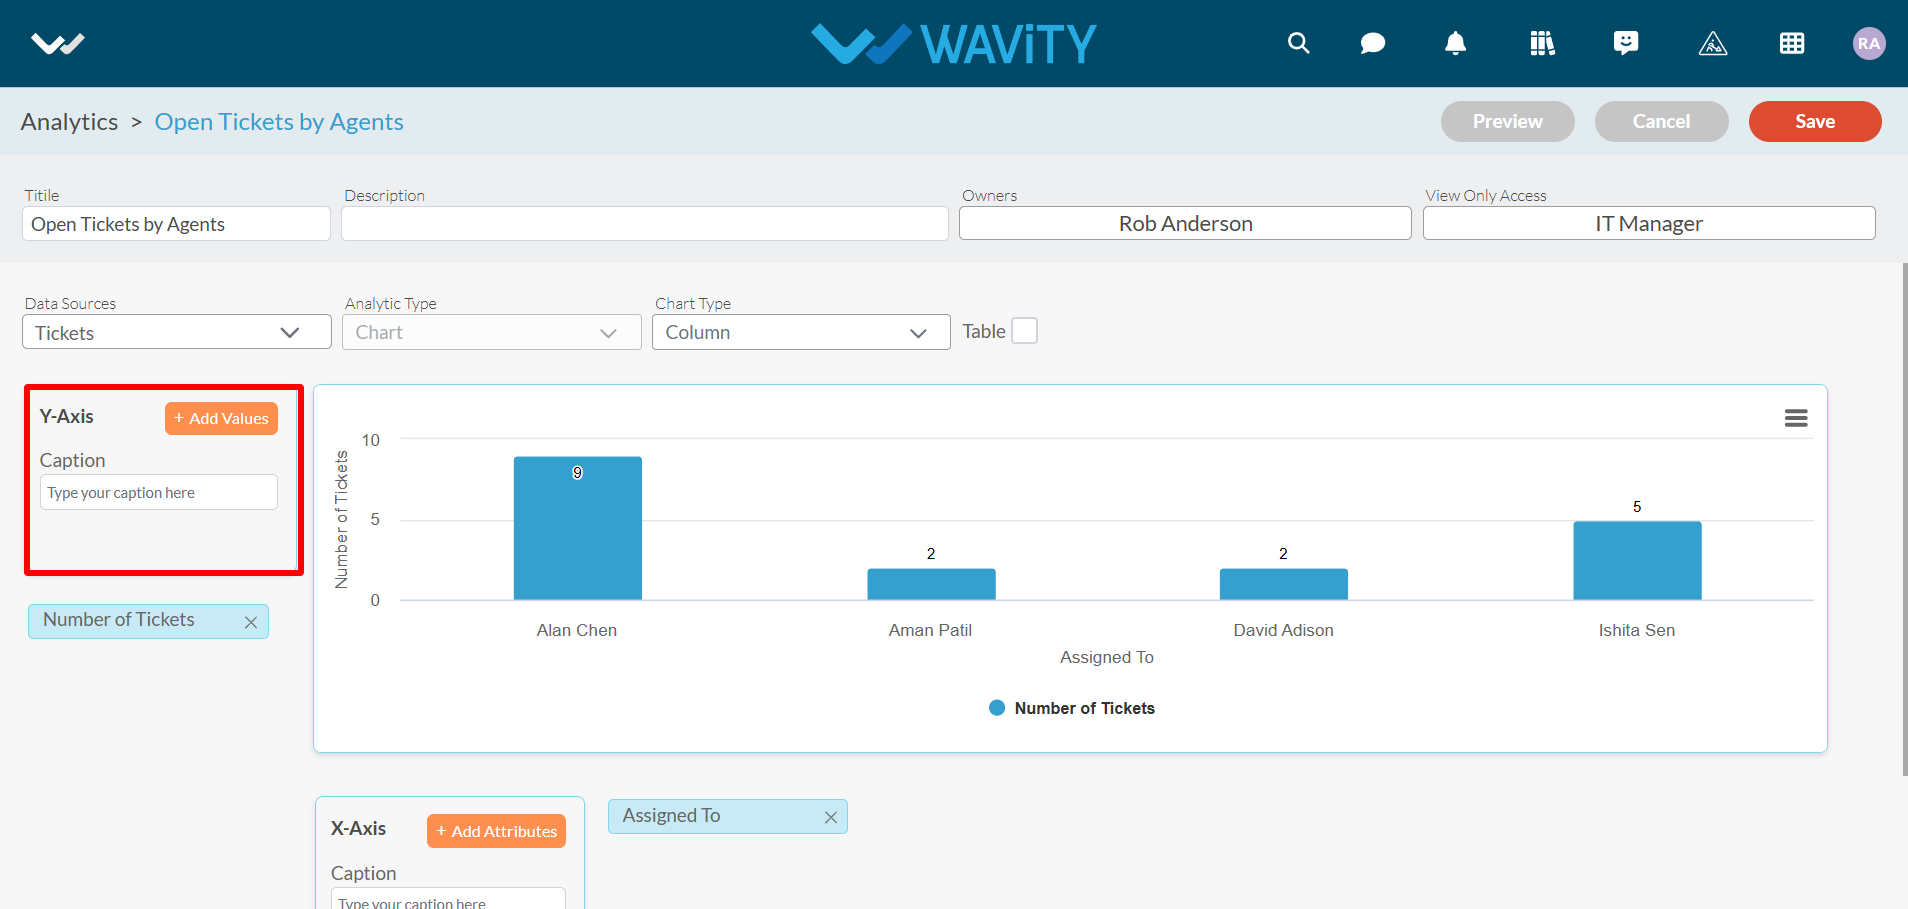
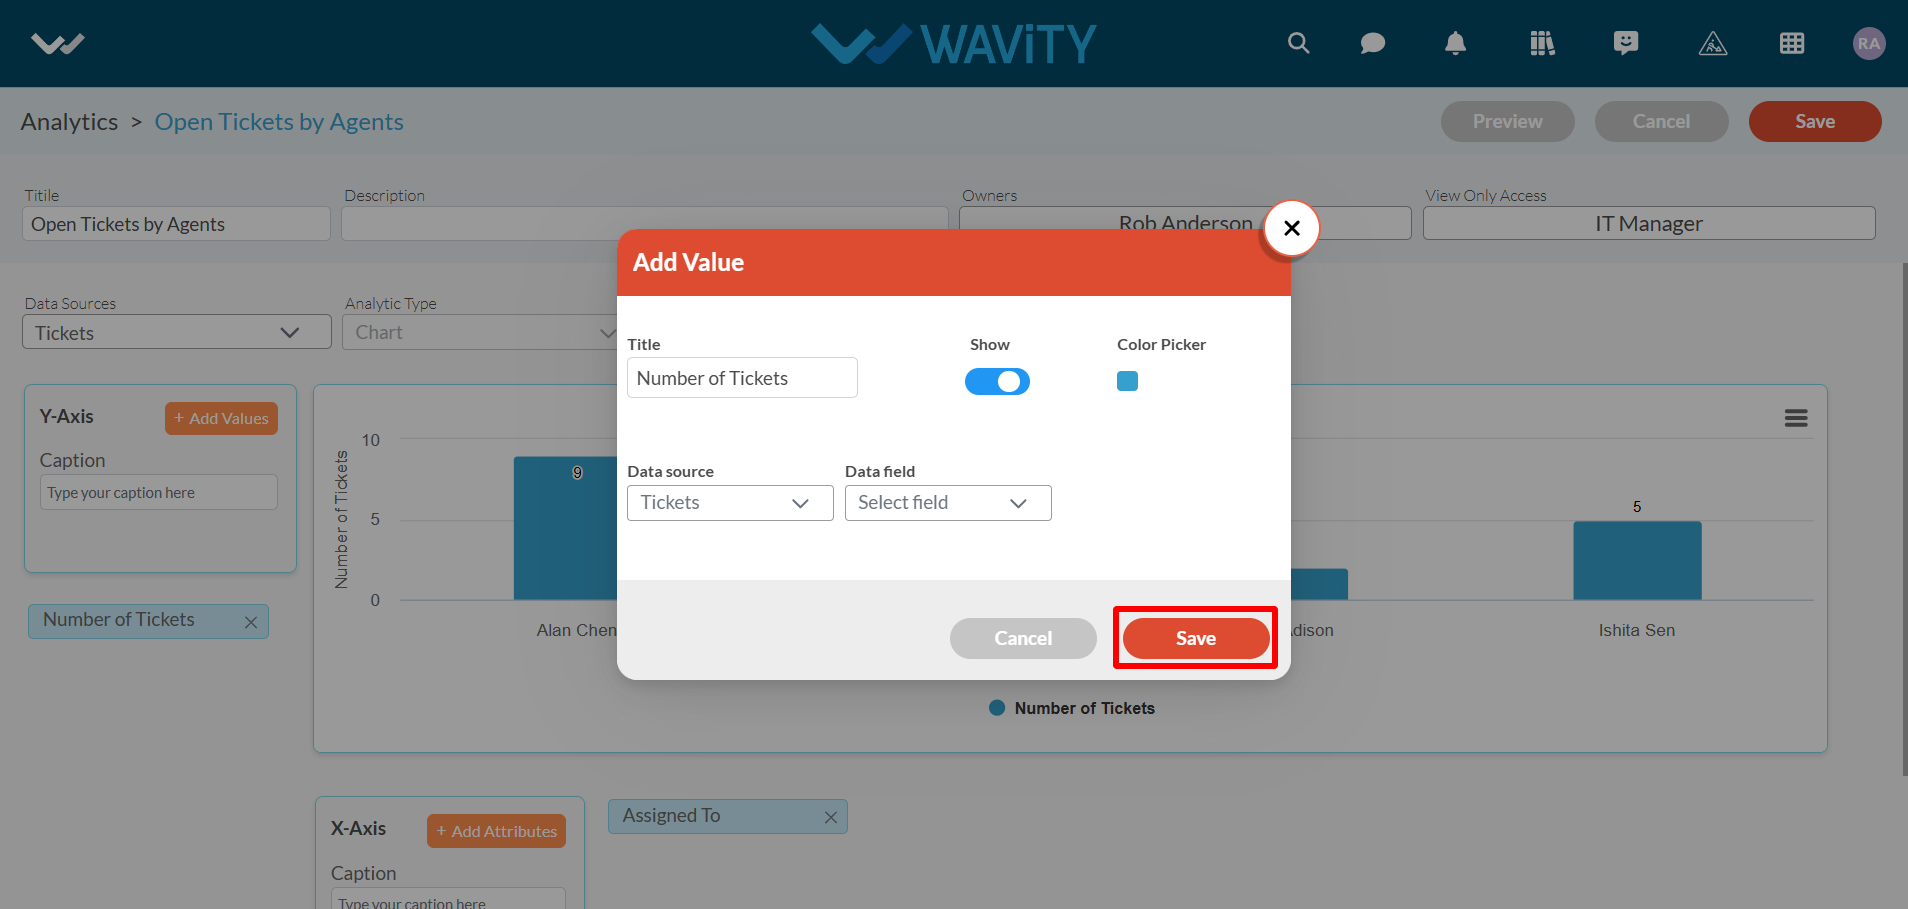
- To add values or attributes, enter the title of the value and select the corresponding data field from the source application, as shown in the image below.
- Click on “Save" button to complete the process.
- Wavity currently supports three types of analytics: Chart, Table, and Summary by Count.
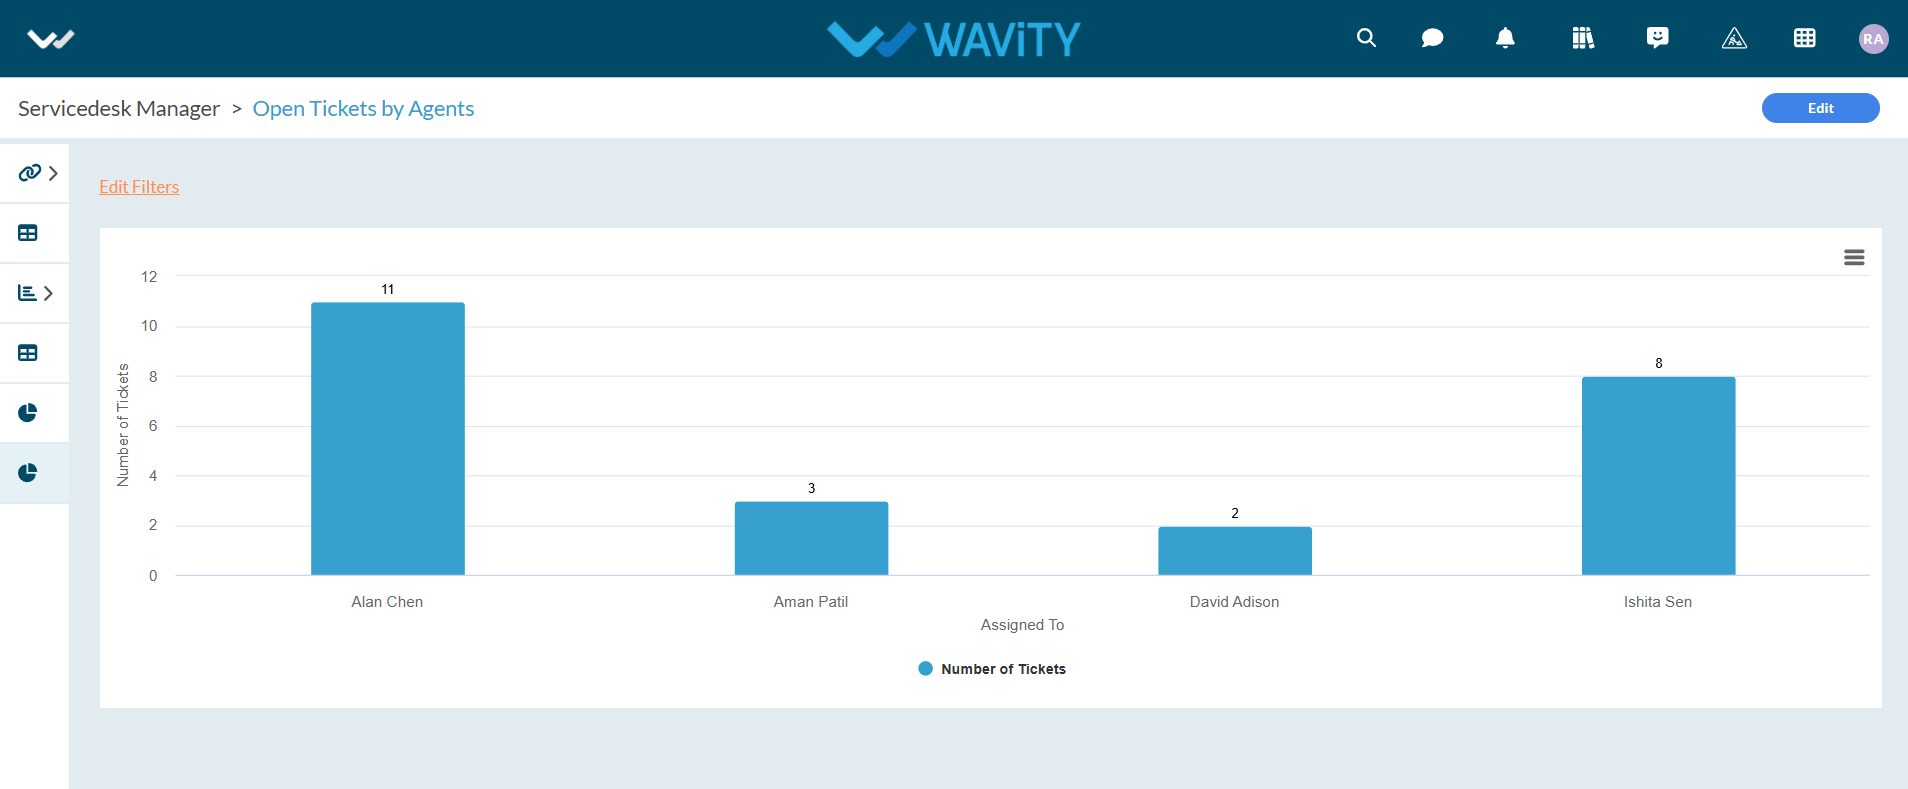
- Chart: This type includes sub-visualization options such as Bar, Column, Pie, Donut, Spline, Line, and Funnel. Below is an example of Chart Analytics.
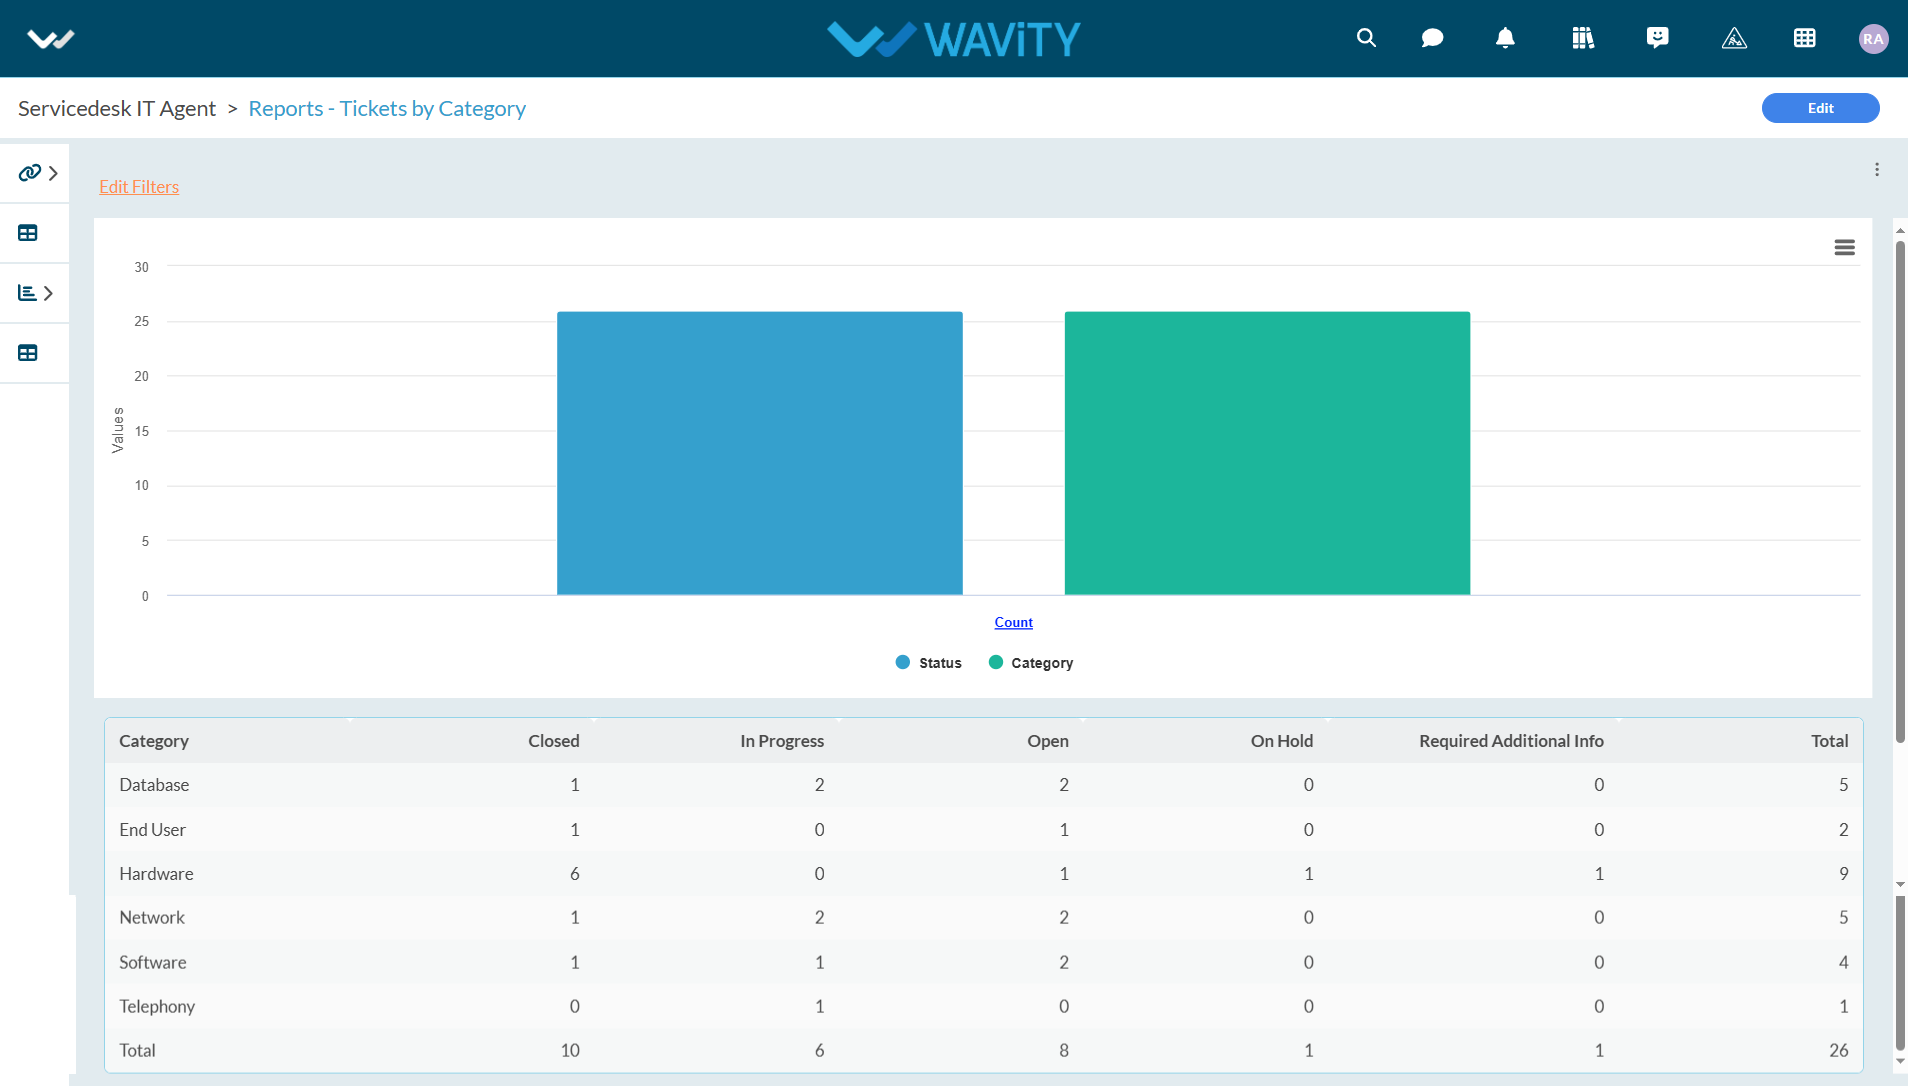
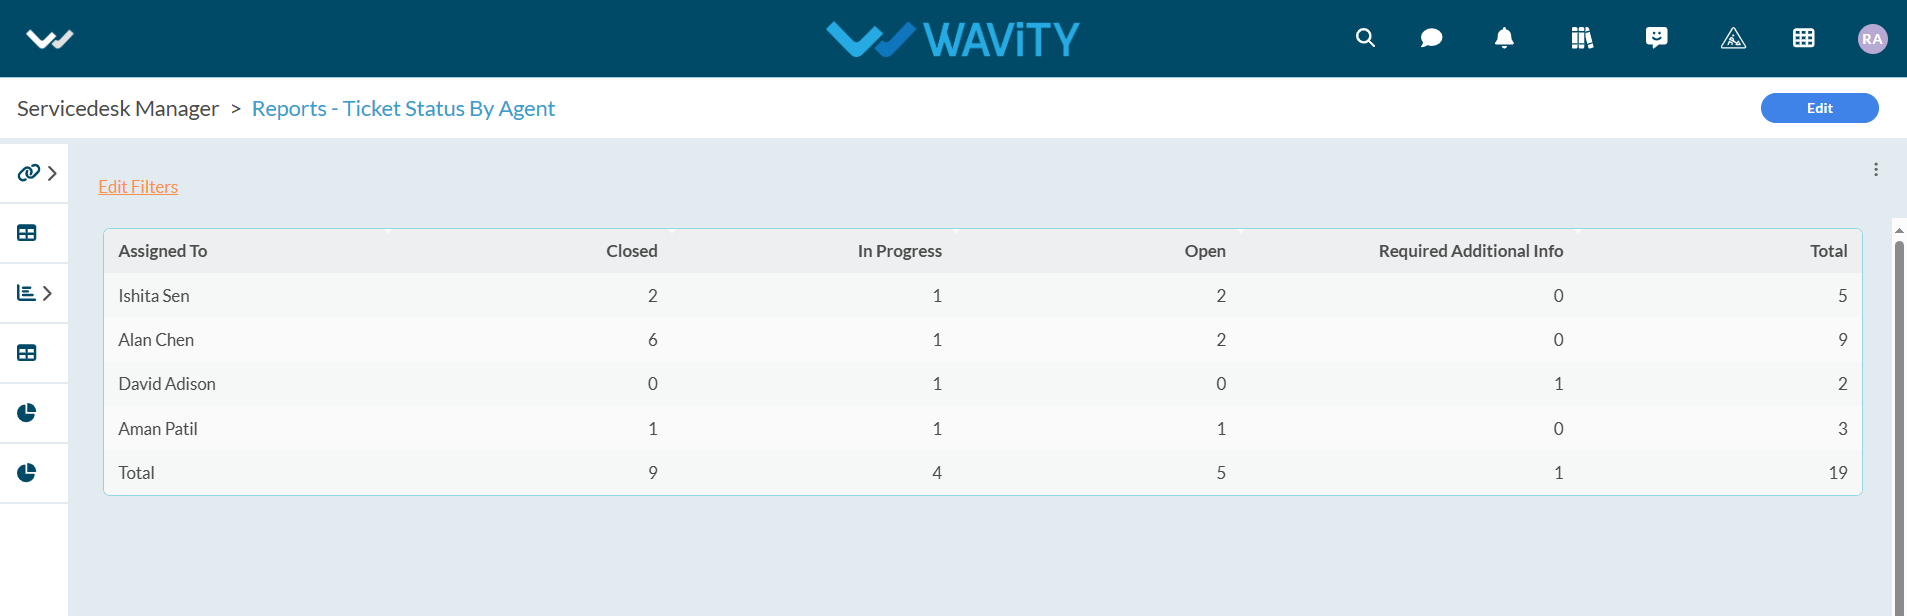
- Table – You can see the analytic Widget in the form of table with as many no. of rows and columns you wanted. Below is an example of Table report.
- Summary By Count – In this type, you will have to select single attribute and single value to create analytic. Below is an example of Summary by Count report.
- For more details on how to add analytics and reports to role-based user interfaces or dashboards, please refer to the following link: How to Add/Edit Widgets and customize Interface/Dashboards | Wavity