How to Add/Edit Widgets and Customize Interface/Layouts
- Widgets in Wavity are interactive components or visual elements within a user interface (UI) that provide users with specific functionalities, data visualizations, or quick access to information and actions.
- Widgets can be added/edited to interfaces/layouts in Wavity platform. This feature allows you to customize layouts based on your requirements. Only Admin of your company has the authority to create or edit widgets in the platform. For more details on creation of dashboards, please refer the following link: How To Create Role-Based Interface/Layouts | Wavity
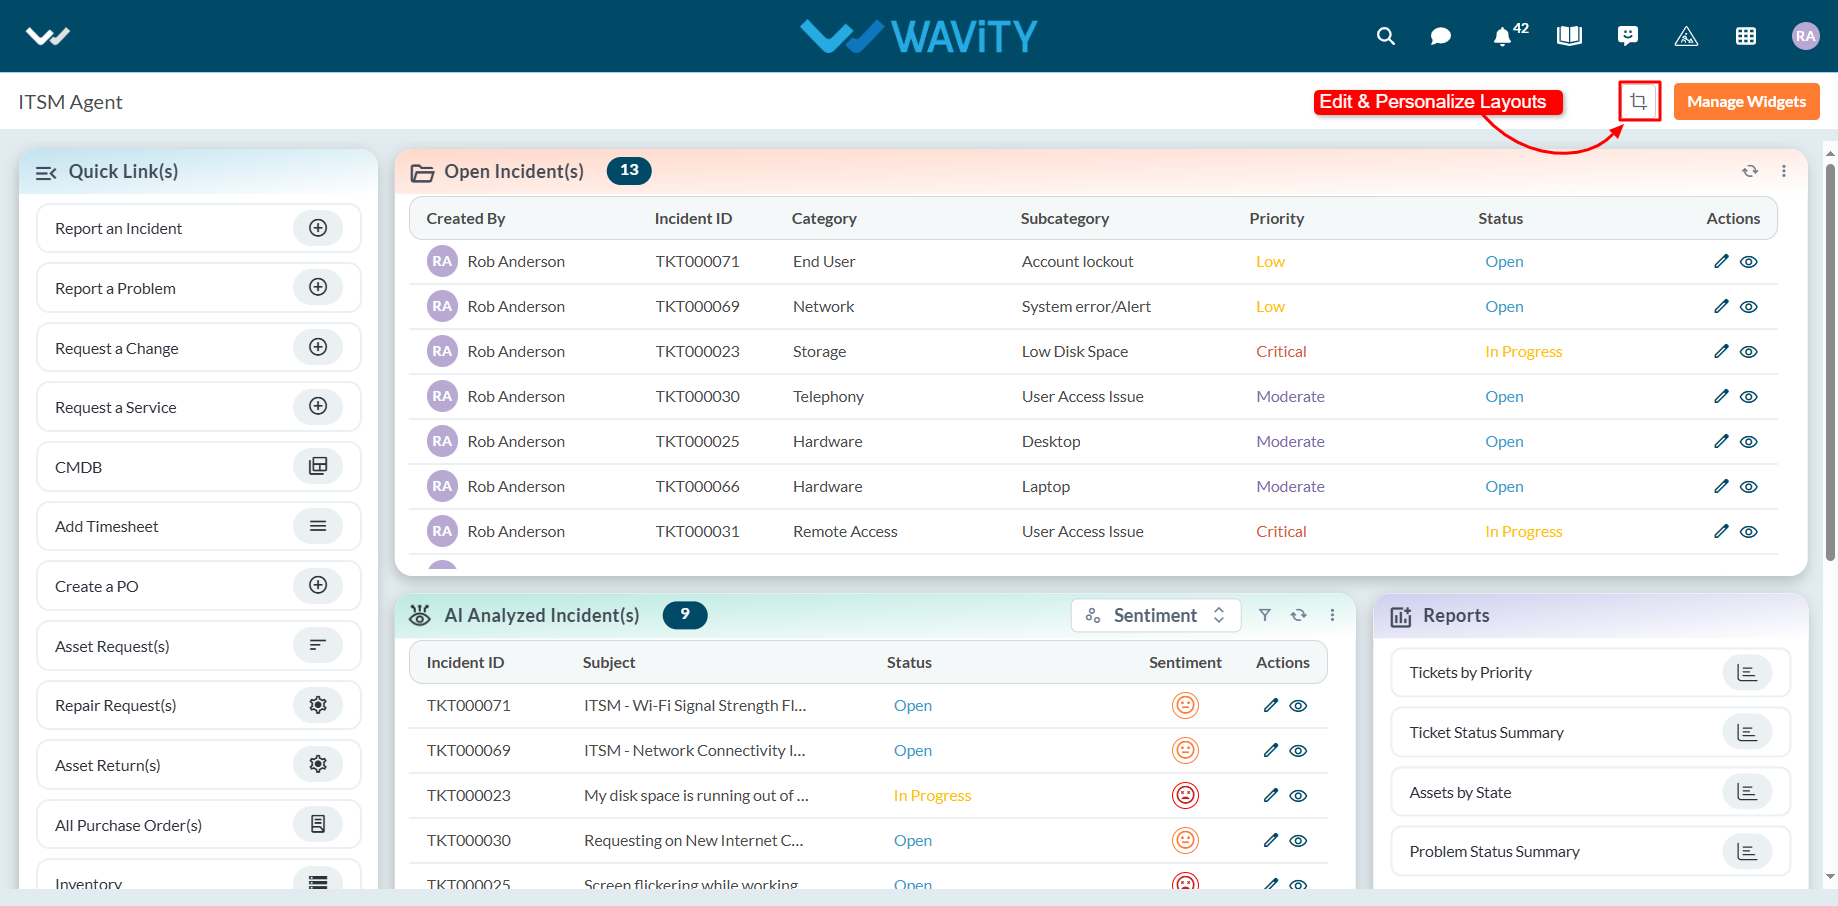
- Existing layouts can be edited or updated in The Platform by the admin. Click on the “Personalize Layout” icon to drag, drop, or resize widgets.
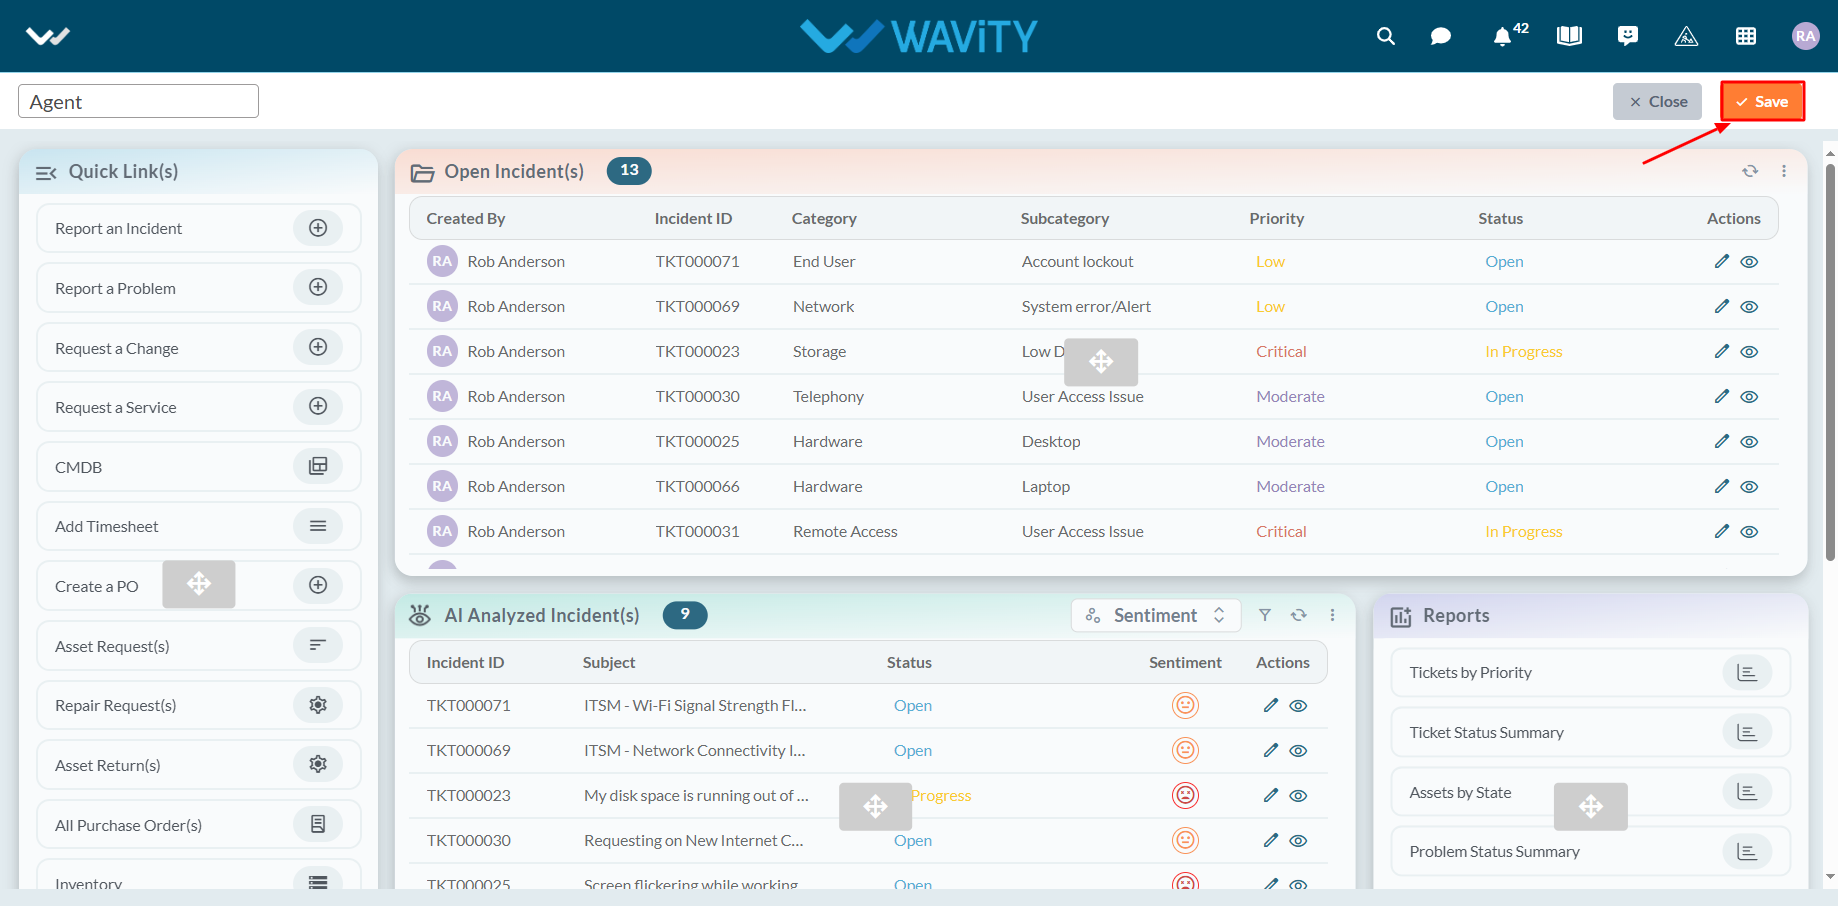
- Use the drag widget icon to drag and drop widgets as per your requirements. Also, you can use the widget borders to resize the widgets.

- Click on ‘Save’ button to update the layout.
- You can use the Refresh icon to update the data in the table widget. Additionally, by clicking the three-dot menu, you have the option to export the data. A filtering feature is also available, as illustrated in the image below.

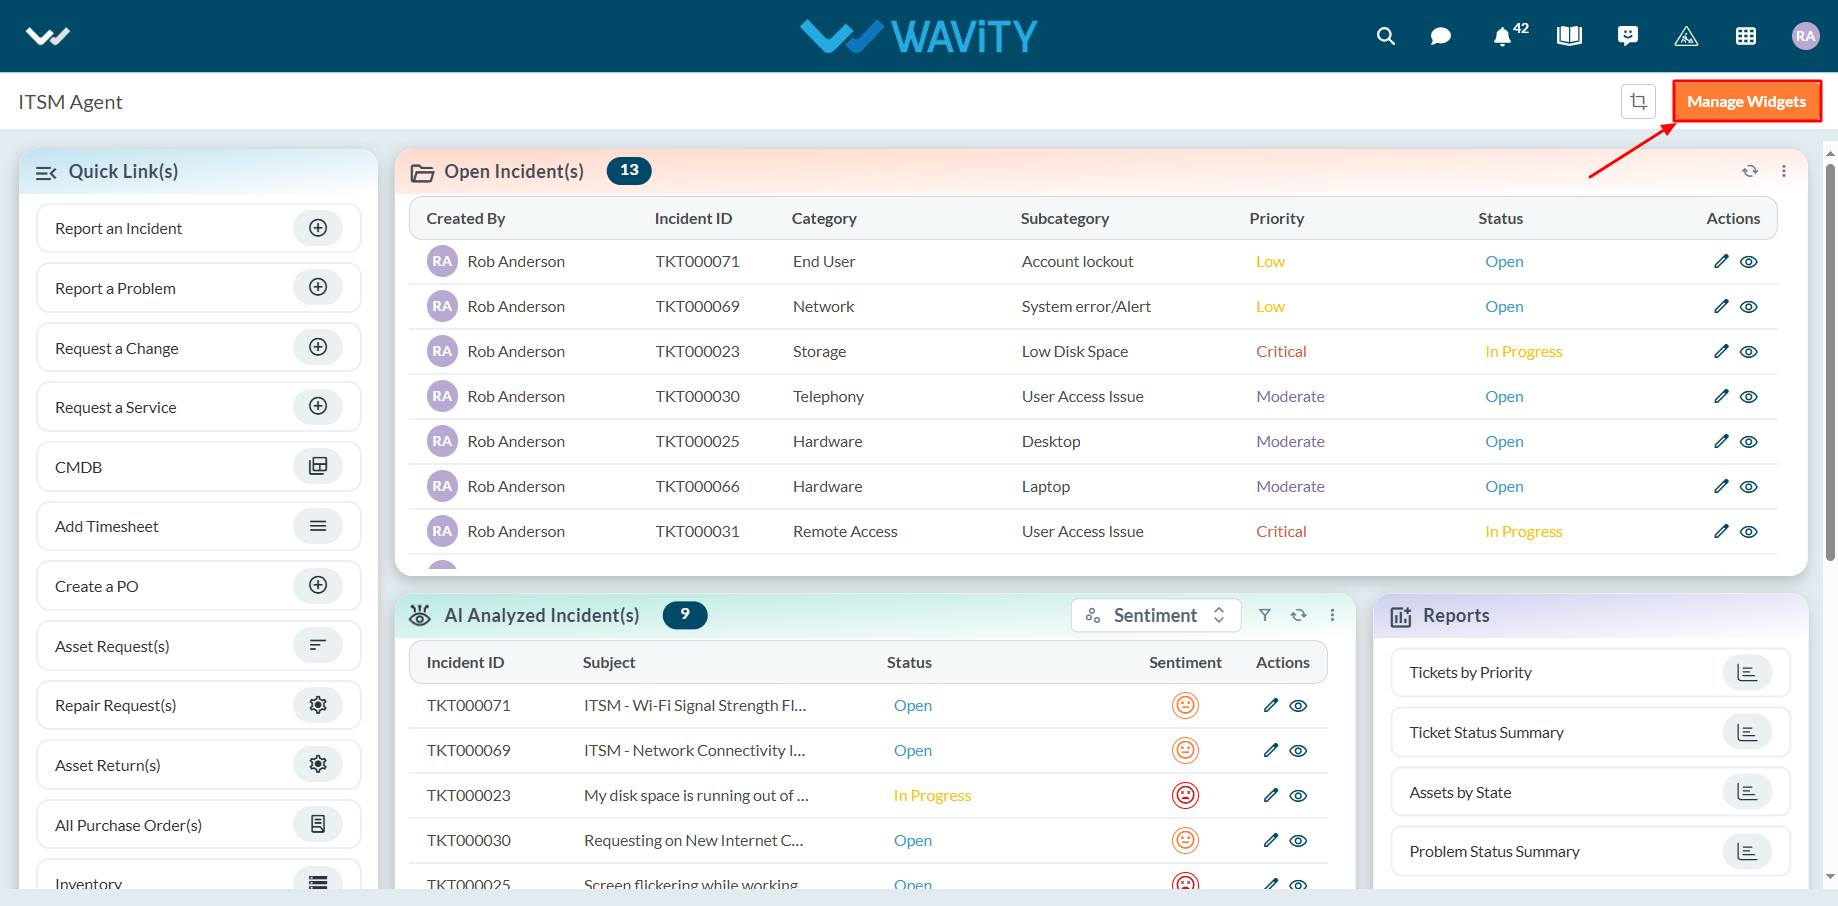
- Administrator of your company can add/ edit/ delete the widgets at any point of time. Click on “Manage Widget” from the layout.
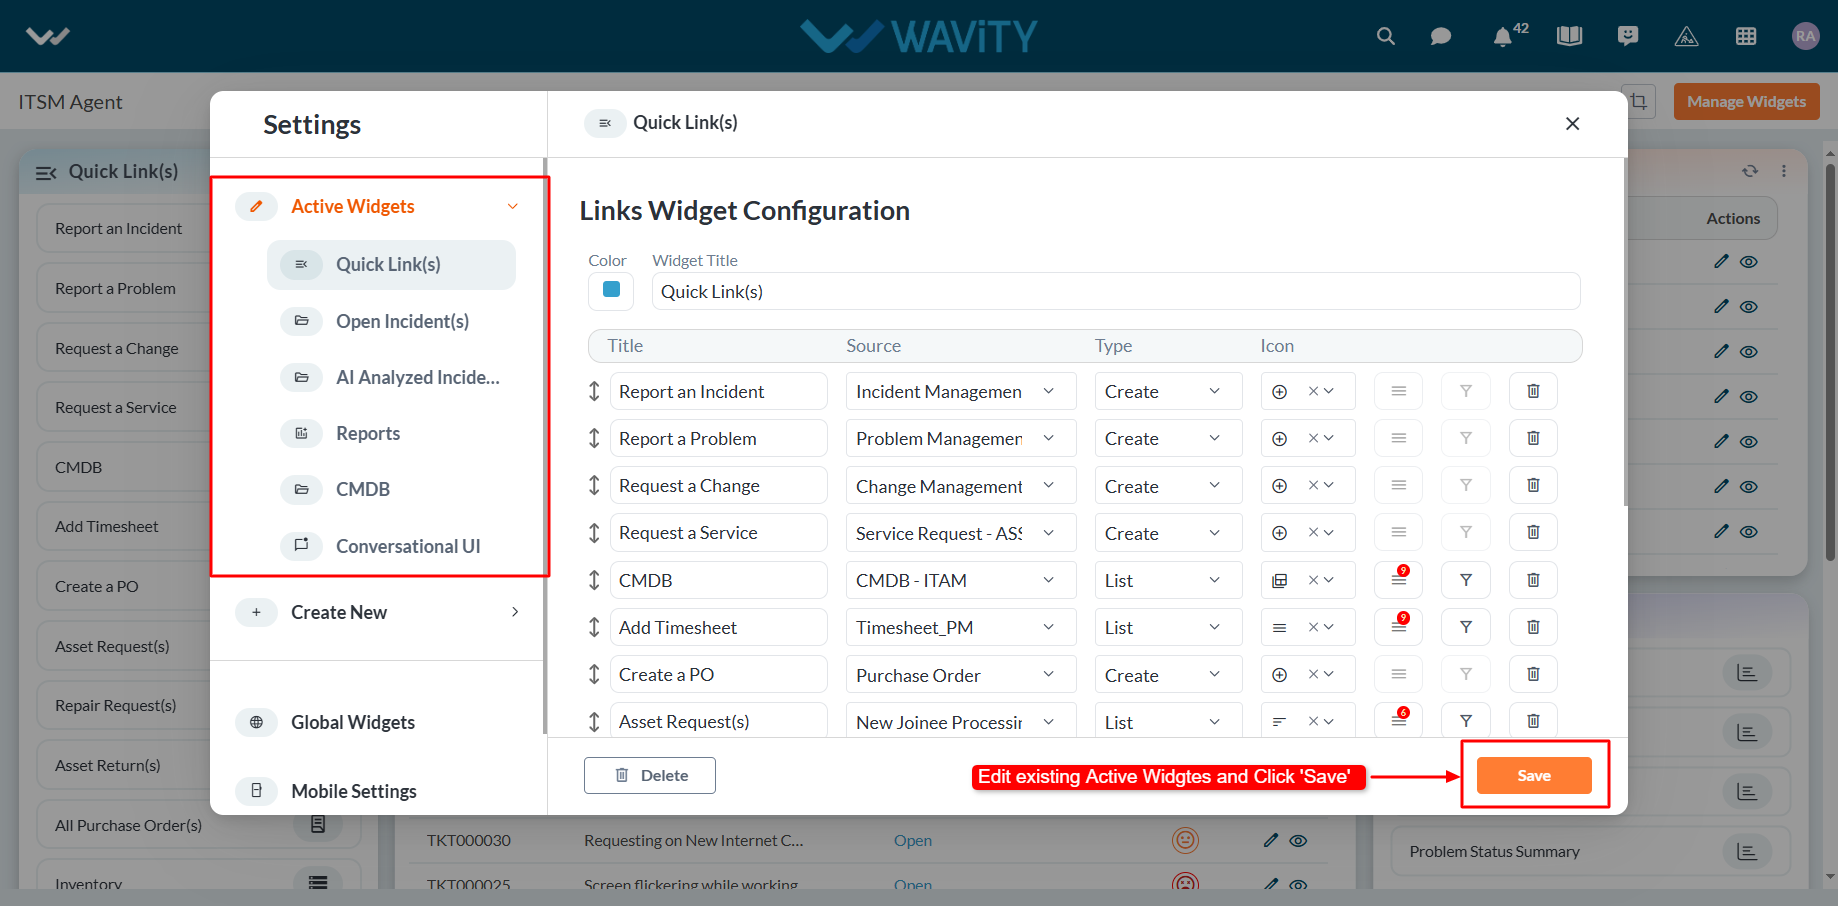
- The Widget Settings pop-up will be displayed. As shown in the image below, all existing active widgets in the layout are listed. To create a new widget, click the ‘Create New’ button.
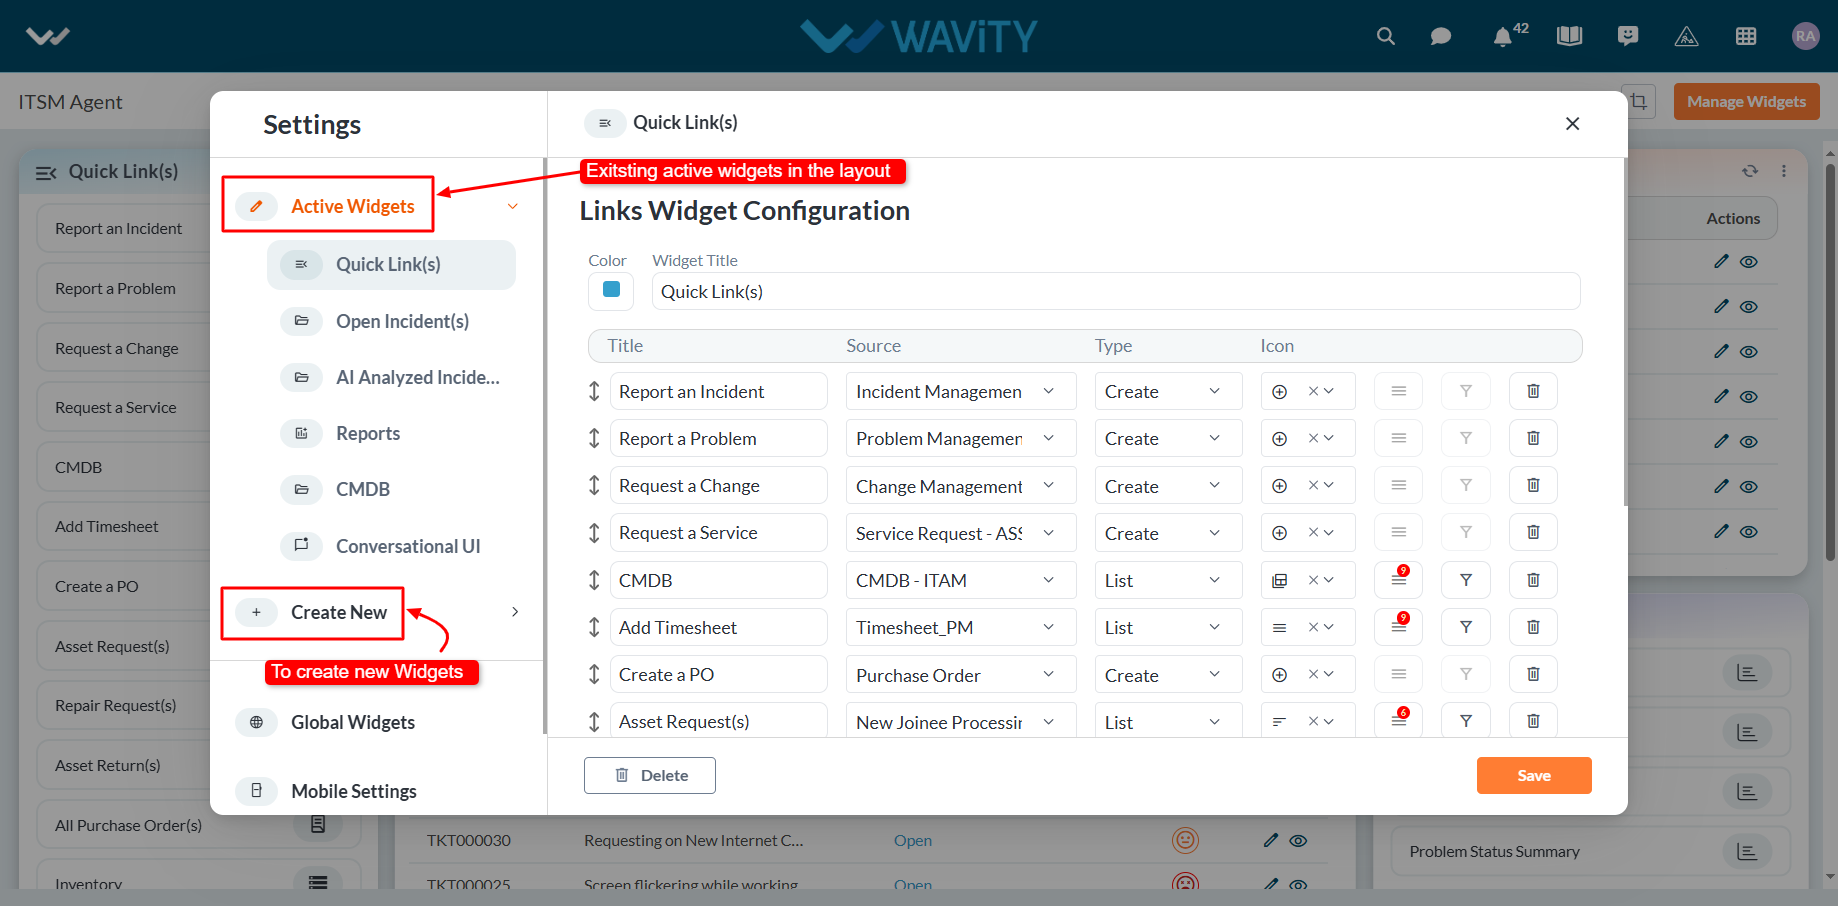
- You can create various types of widgets such as Reports, Analytics, Table, Links, Bulletin & Columns in the layout.
- To create a new link widget, click on "Links".
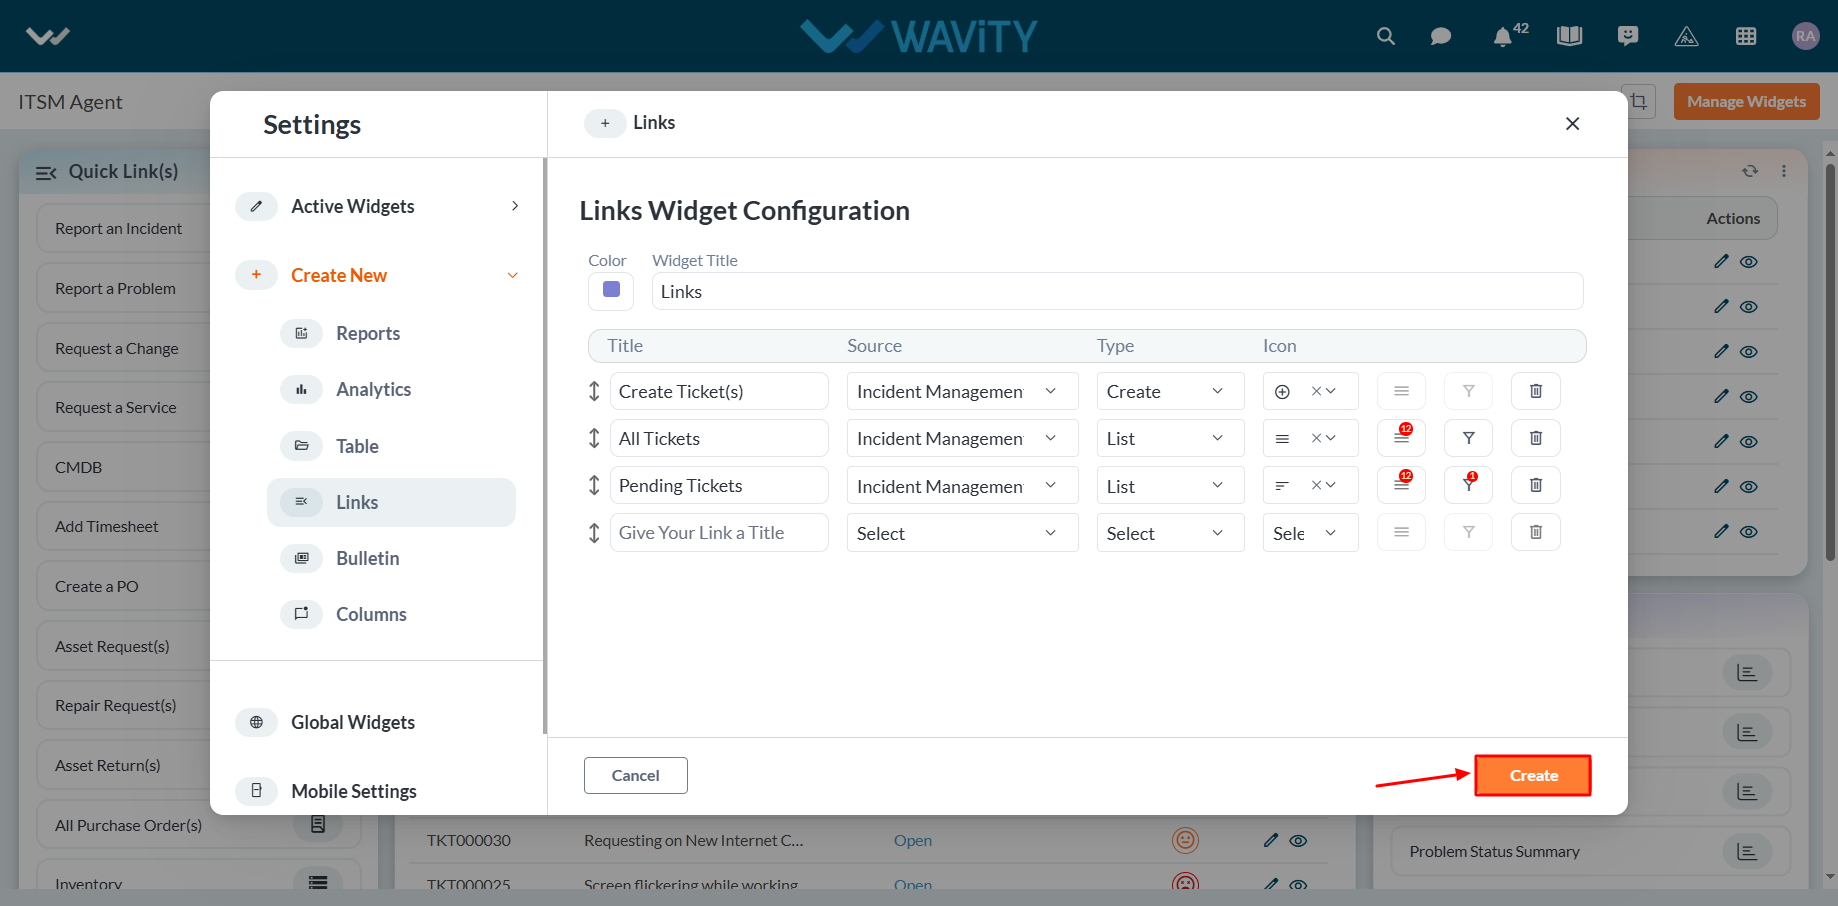
- Choose a color for the widget to customize its appearance.
- Enter a title for the widget to identify it clearly.

- Provide a title for the individual link, as shown below. Then, select the appropriate data source or application from which the data will be displayed.
- Choose the type of view to display in the widget when the title link is clicked:
- Selecting "Create" will open a new form with fields to be filled out.
- Selecting "List" will display all existing records from the selected data source or application/forms.
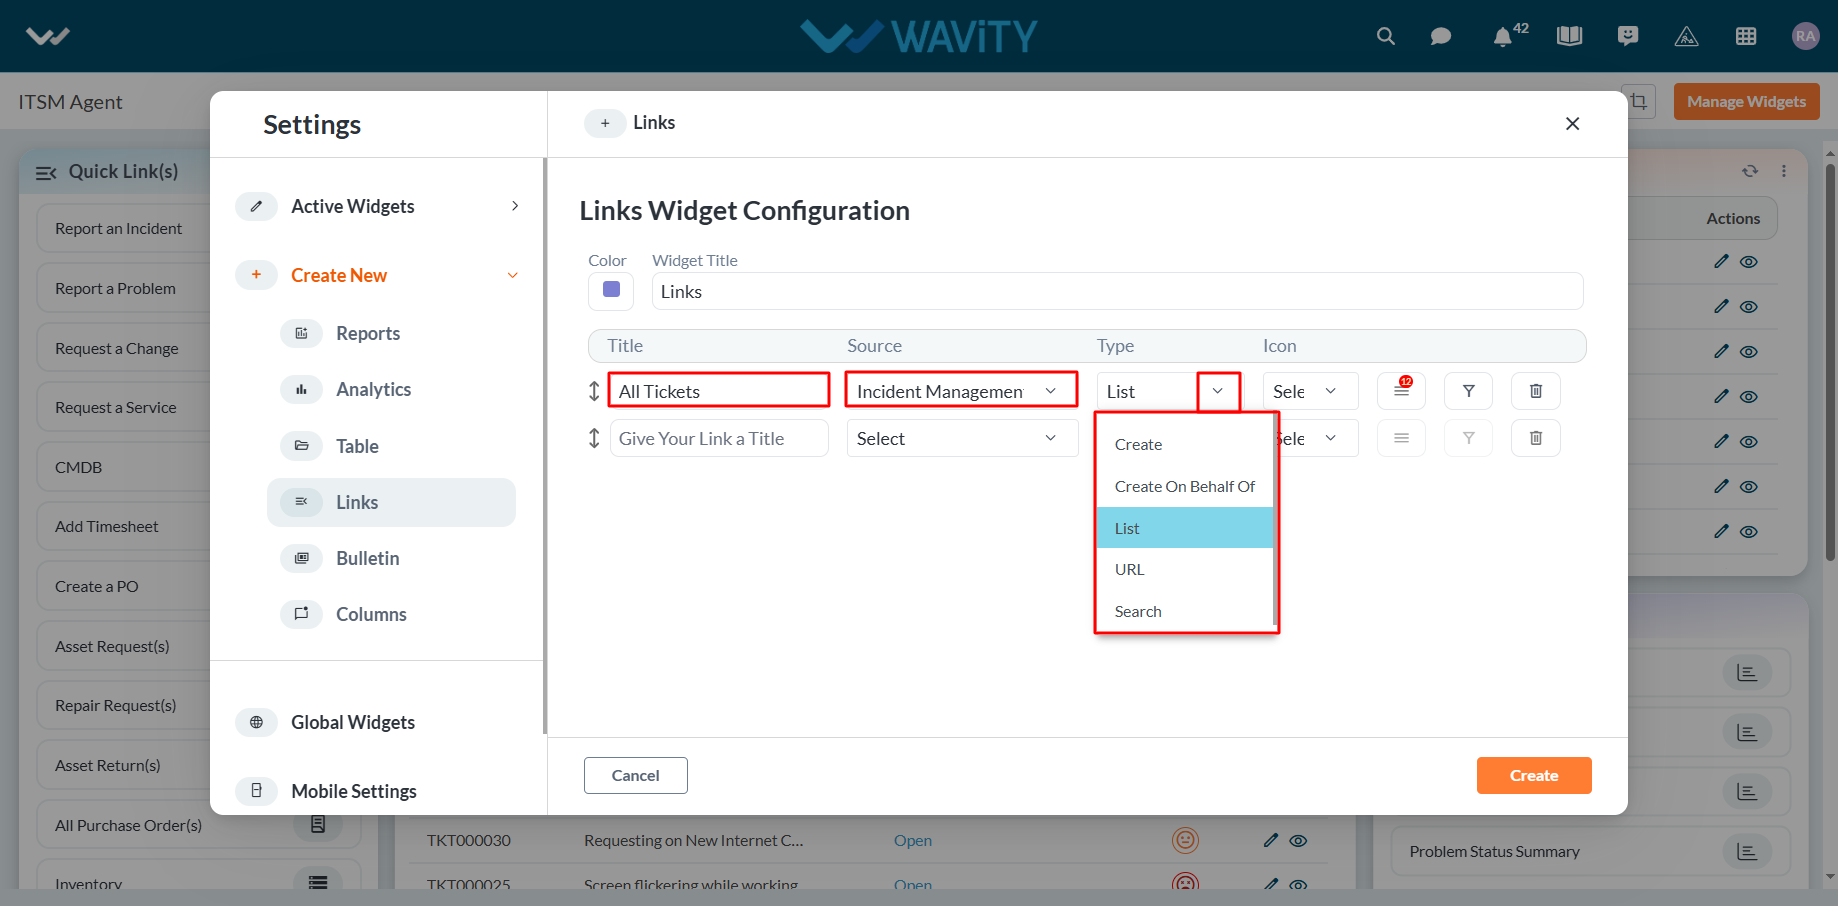
- Select the icon from the dropdown as shown in below image.

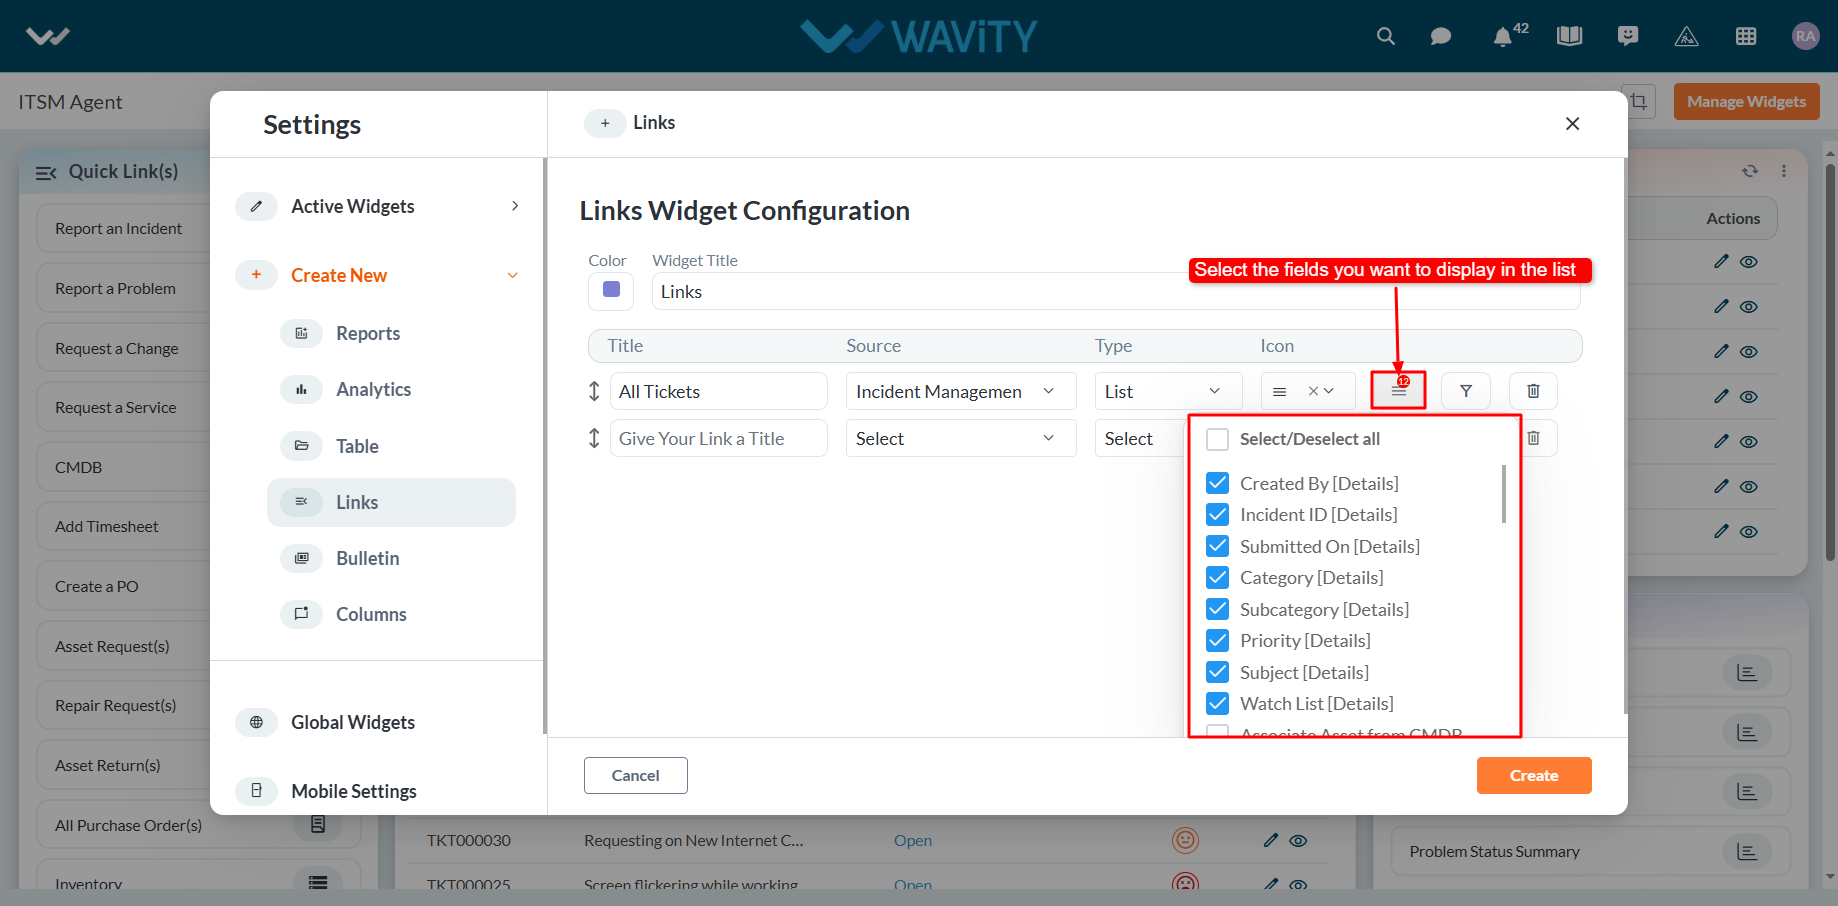
- Select the ‘Box’ icon to select the form fields as per your requirements. You can select or deselect any of the fields asper your requirement. Only the selected data fields will be displayed after clicking the link.
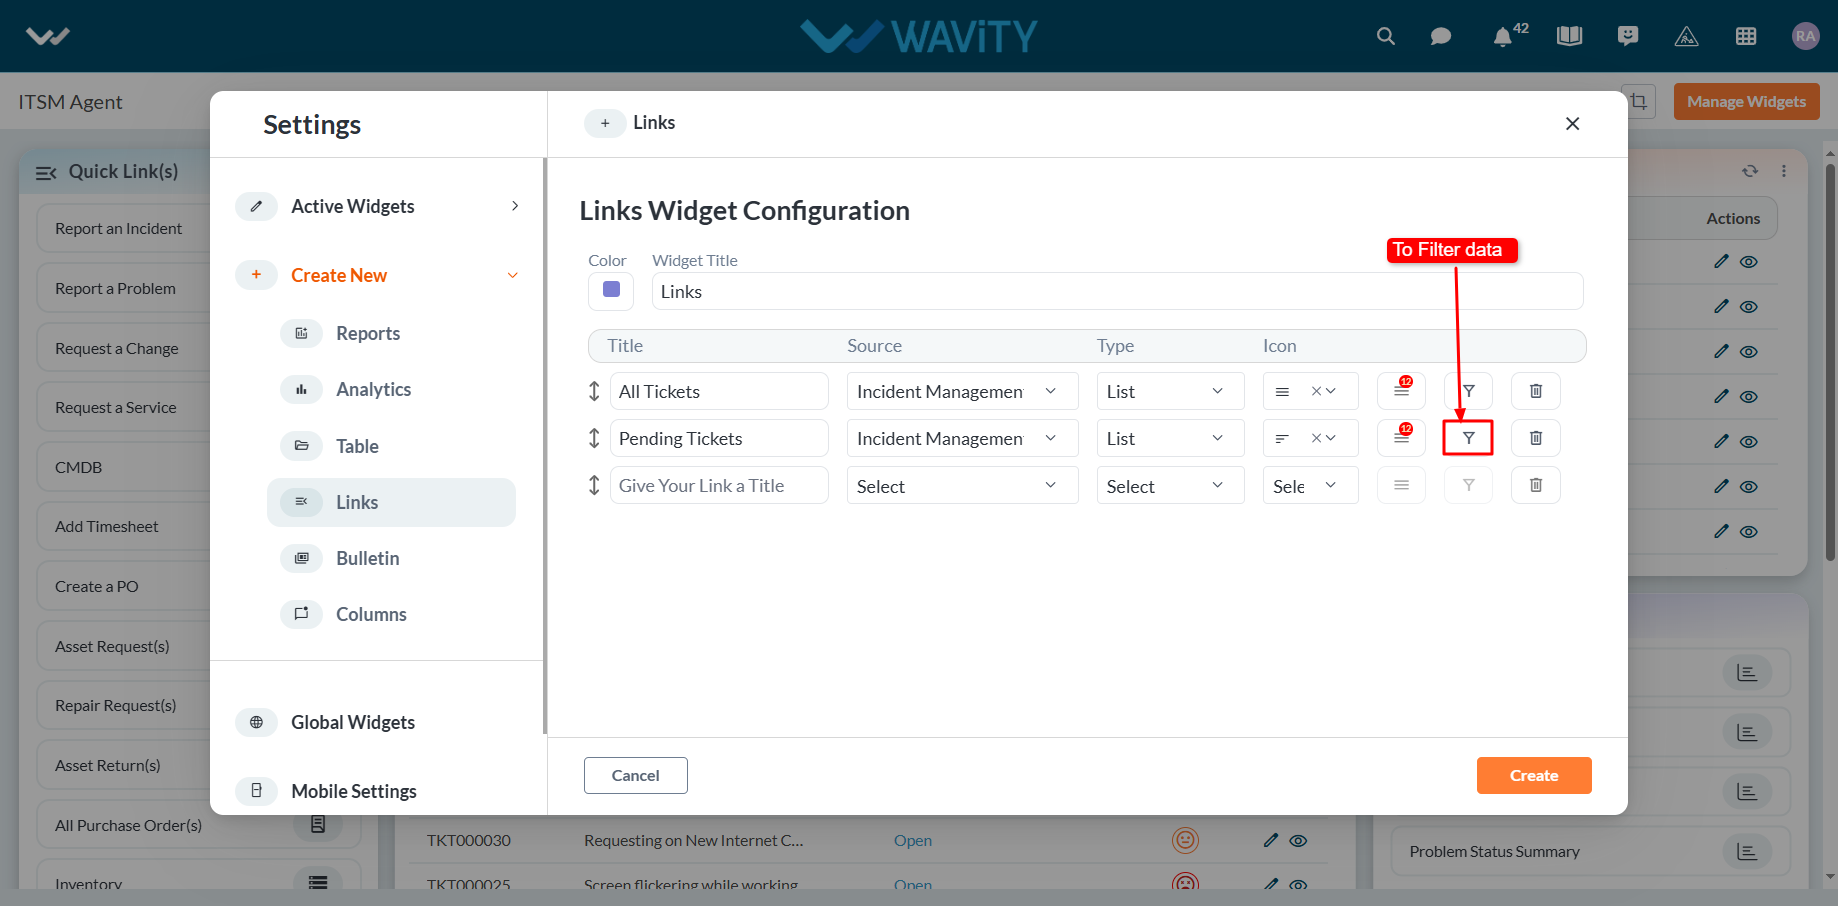
- Similarly, you can add more links as needed. To apply a filter, click the ‘Filter’ icon.
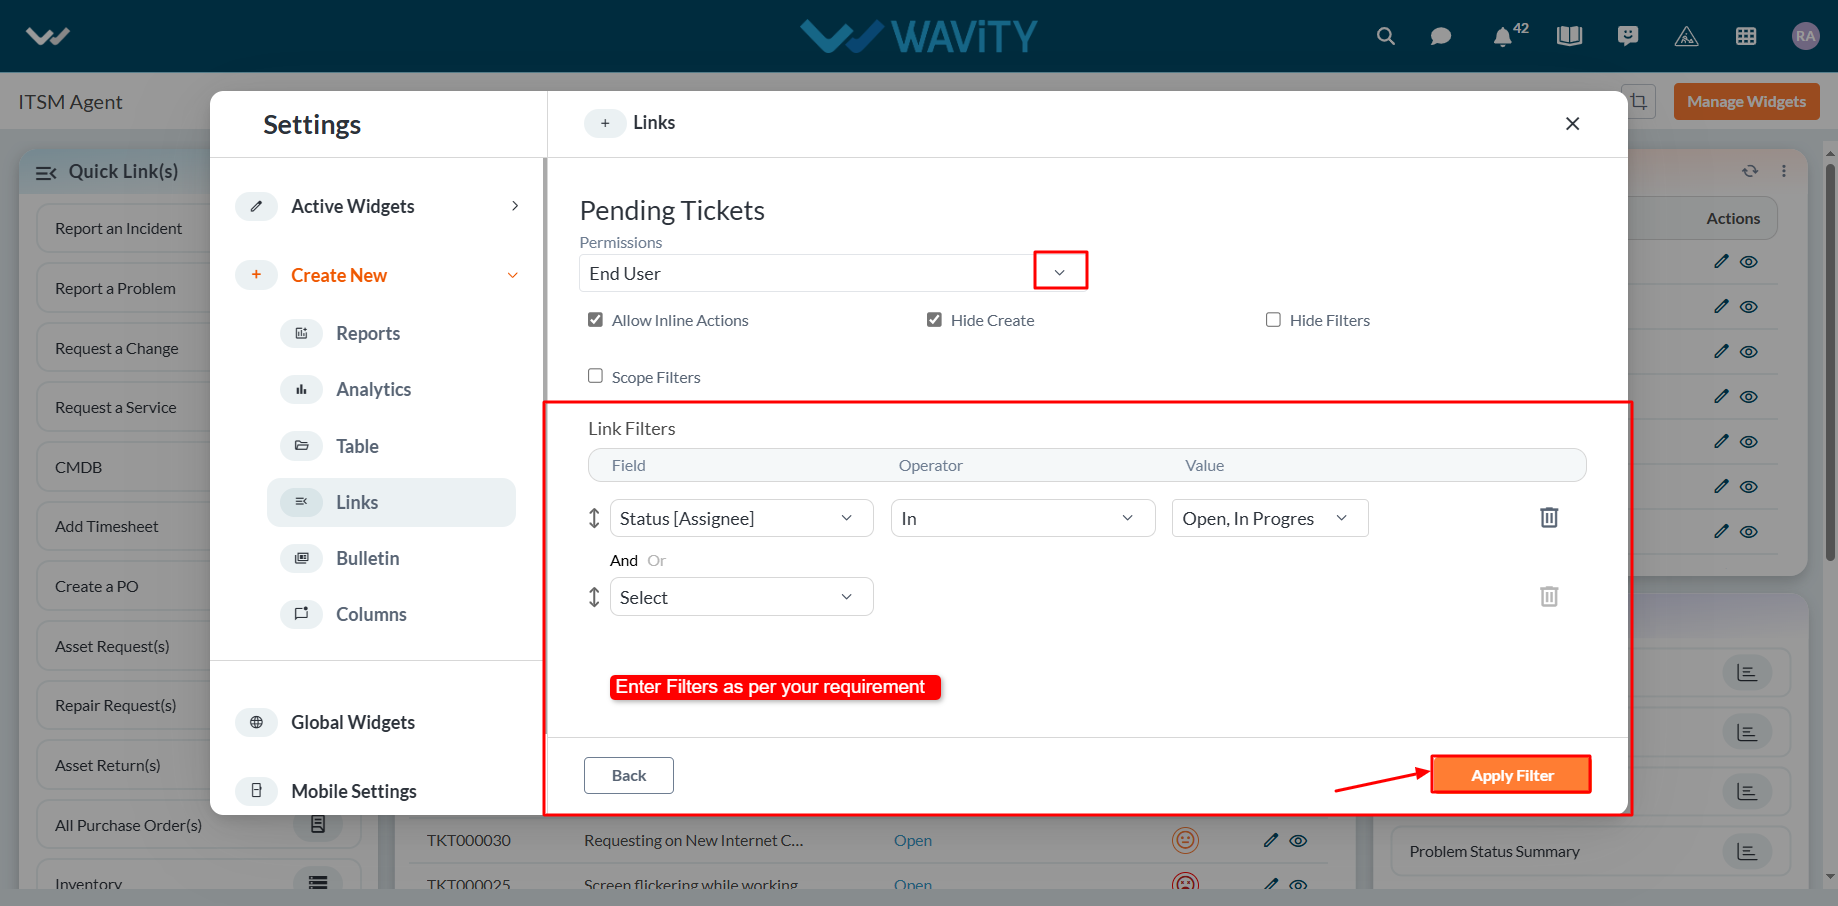
- Under Permissions, select the appropriate user category such as End User, Approver, Manager, or Moderator, as shown below. Only users in the selected category will be able to view or edit the link to the data source application.
- Choose the field from the data source application that you want to filter. You can apply various operators such as Equal, Not Equal, In, Empty, and Not Empty.
- Based on the selected field, all corresponding values will be displayed in the Value dropdown. Select the required value to apply the filter.
- To add more complex filtering conditions, you can use the "And" and "Or" functions: Enabling "And" will apply the filter only if all conditions are met. Enabling "Or" will apply the filter if any condition is met.
- Finally, click the "Apply Filters" button, as shown below.
- Click on “Create” button to create a new link widget.
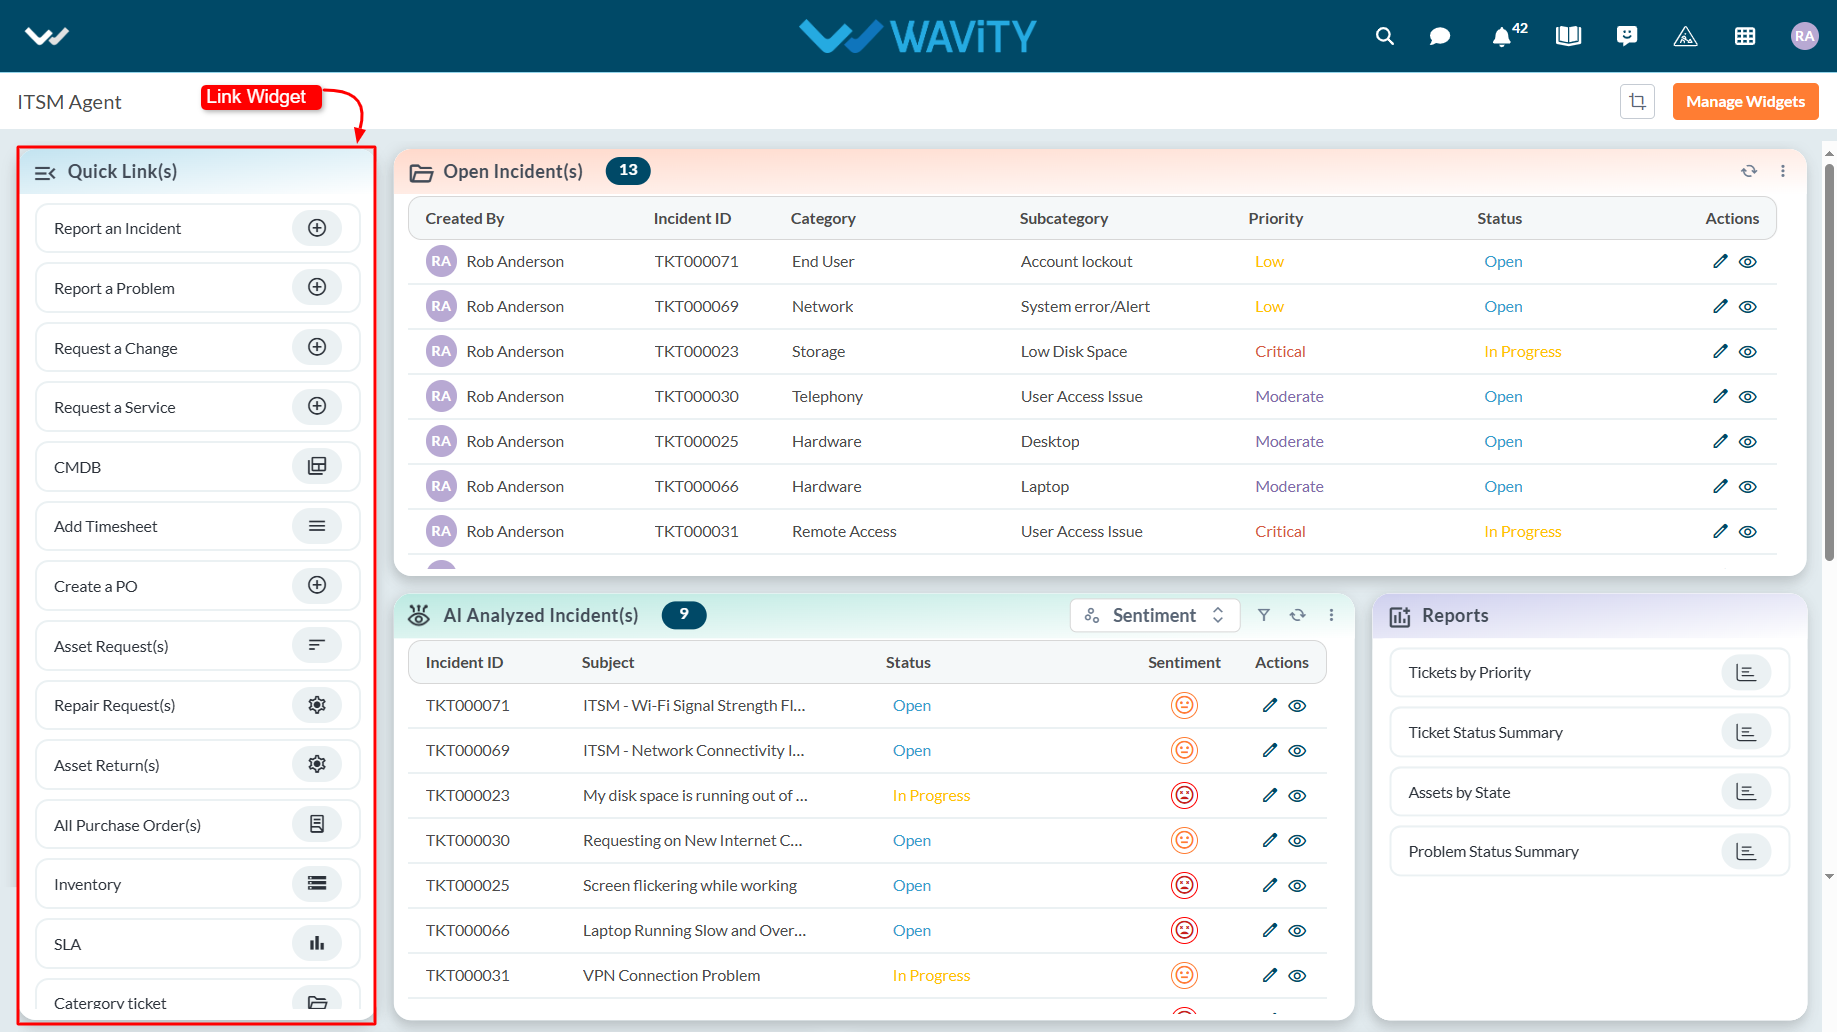
- An example of a link widget is shown below for your reference.
- Similarly, you can custom create various widgets such as Reports, Analytics, Table, Bulletin and Columns in the layout, as needed.

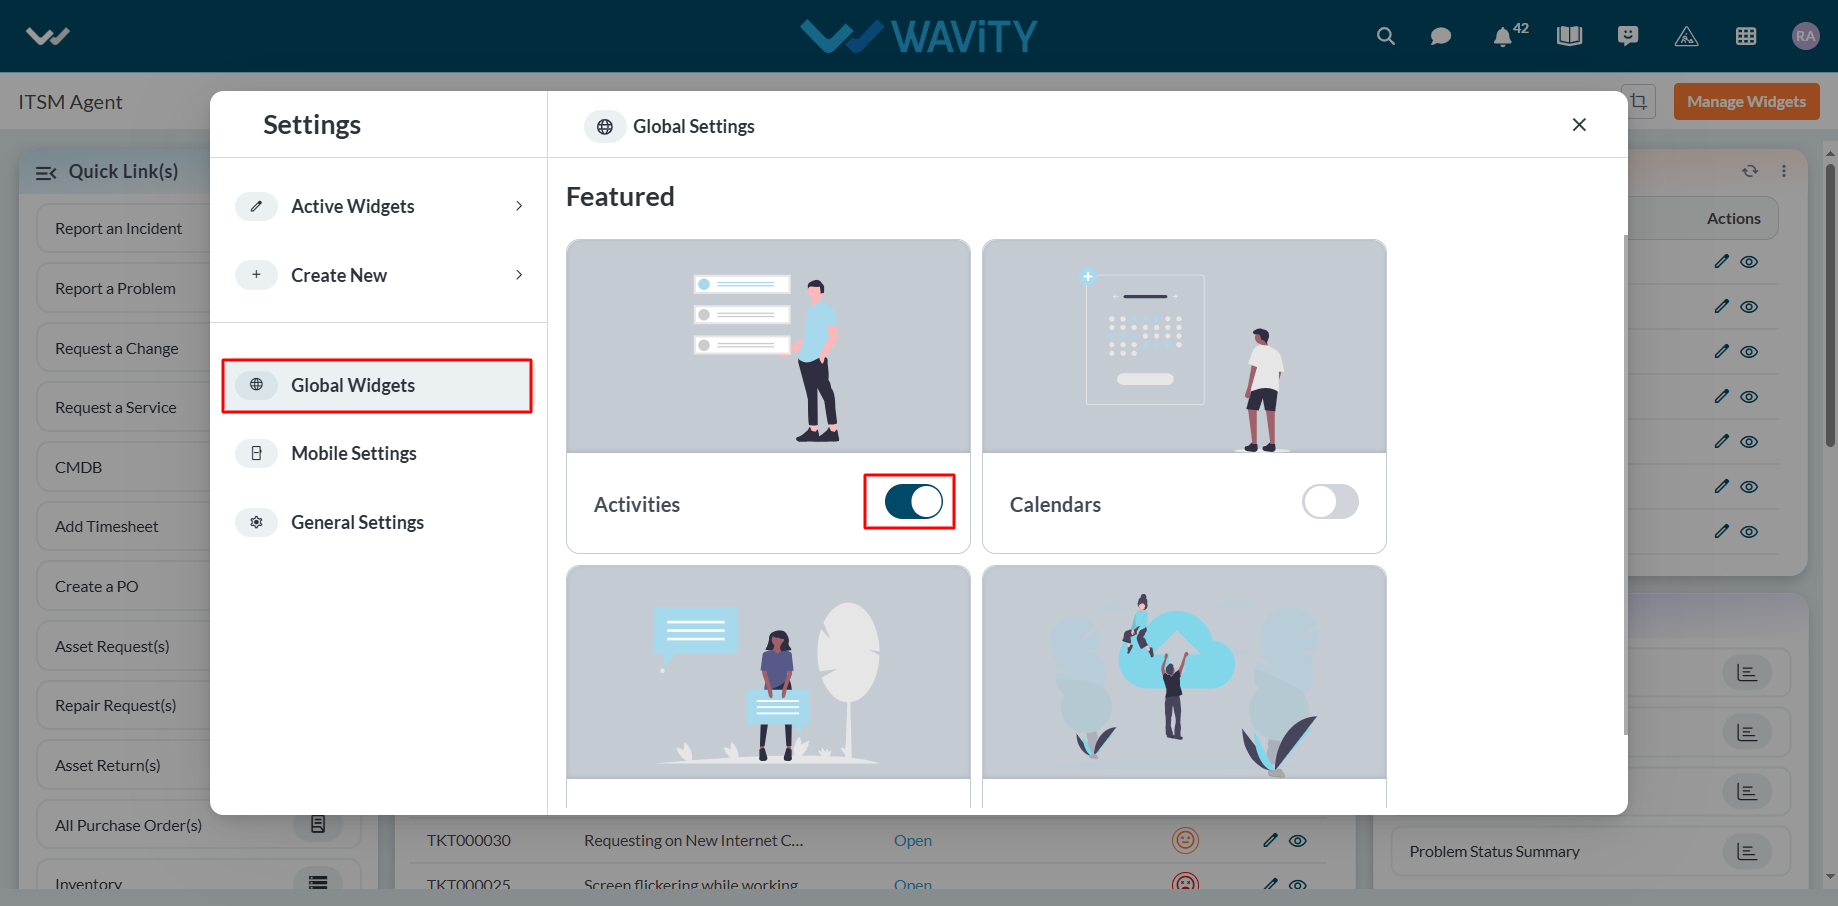
- You can add a global widget if needed by simply toggling the Global Widget switch on or off.
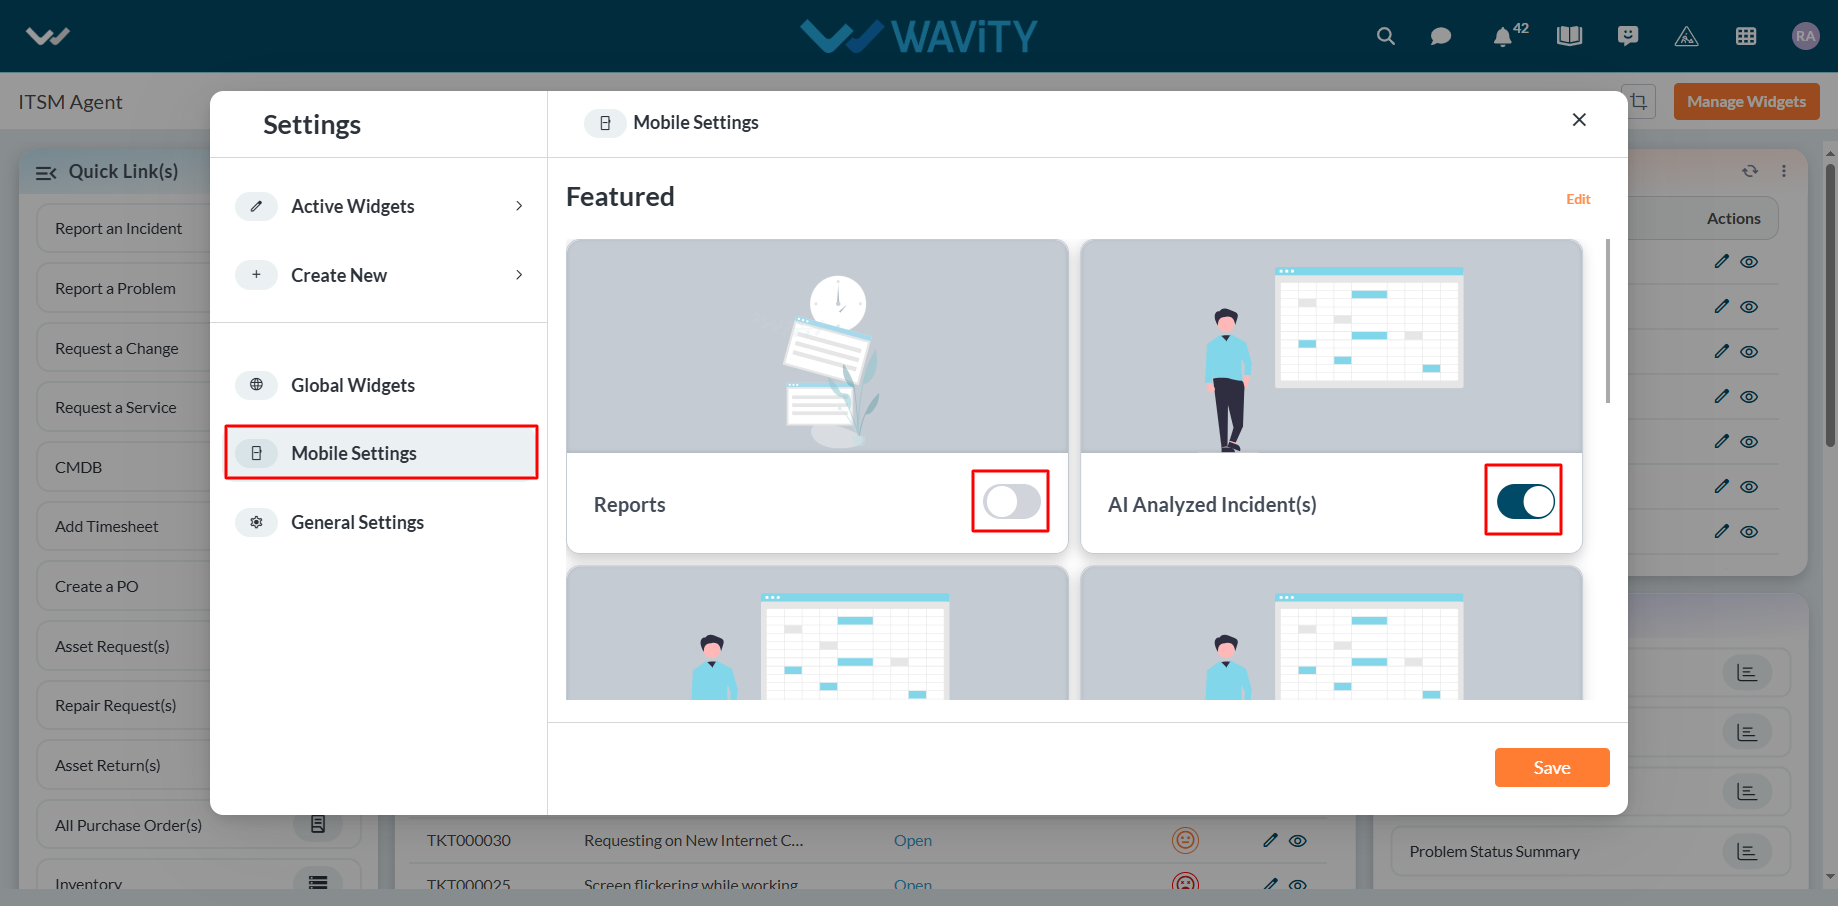
- Similarly, you can choose which widgets should appear in the Wavity Mobile App by simply toggling the desired widgets on or off within the layout.
- All existing active widgets can be edited or updated as needed. Once the changes are made, click Save to apply the updates in real time to the role based interface or layout.