Creating a Table Widget in Wavity
- Widgets in Wavity are interactive components or visual elements within a user interface (UI) that provide users with specific functionalities, data visualizations, or quick access to information and actions.
- Widgets can be added/edited to interfaces/dashboards in Wavity platform. This feature allows you to customize dashboards based on your requirements. For more details on creation of dashboards, please refer the following link: How To Create Role-Based Interface/Dashboards/Layouts | Wavity
- A Table Widget in Wavity mirrors the functionality of an app but is used specifically to display data within a dashboard or interface. It pulls information directly from the associated application and presents it in a tabular format, tailored to your chosen fields.
- Only an Admin of your organization has the access to create or update widgets in Wavity.
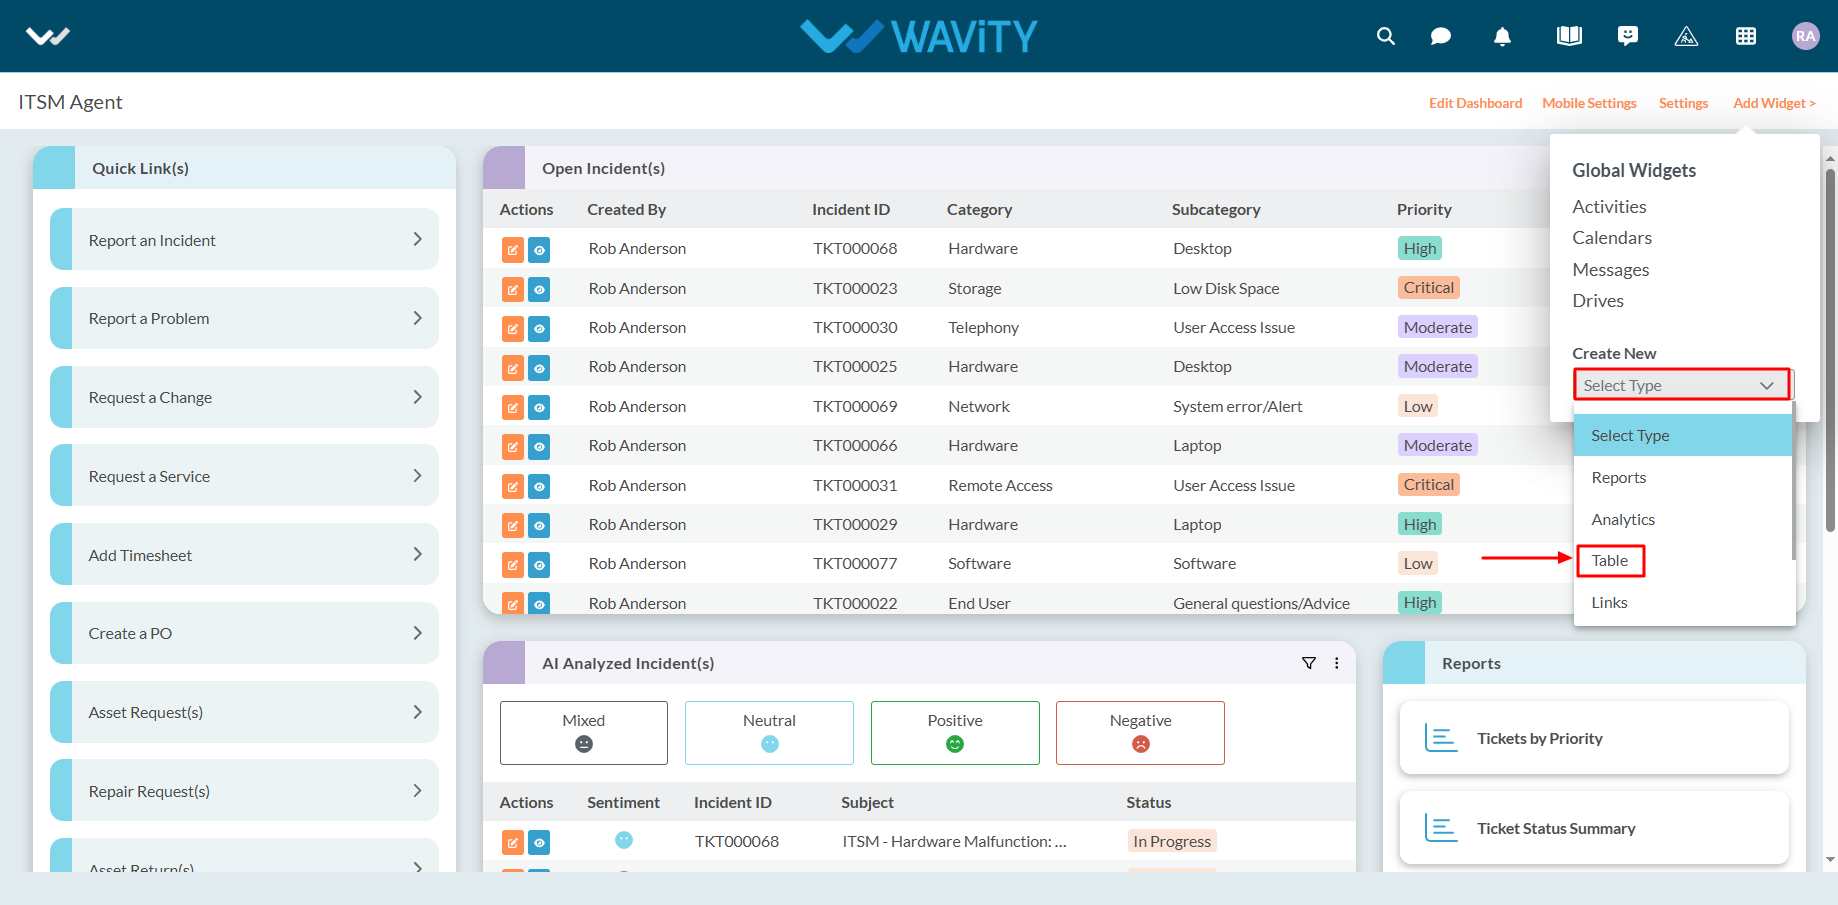
- To create a Table widget: Click on “Add Widget”, then select “Table” from the Create New dropdown menu.
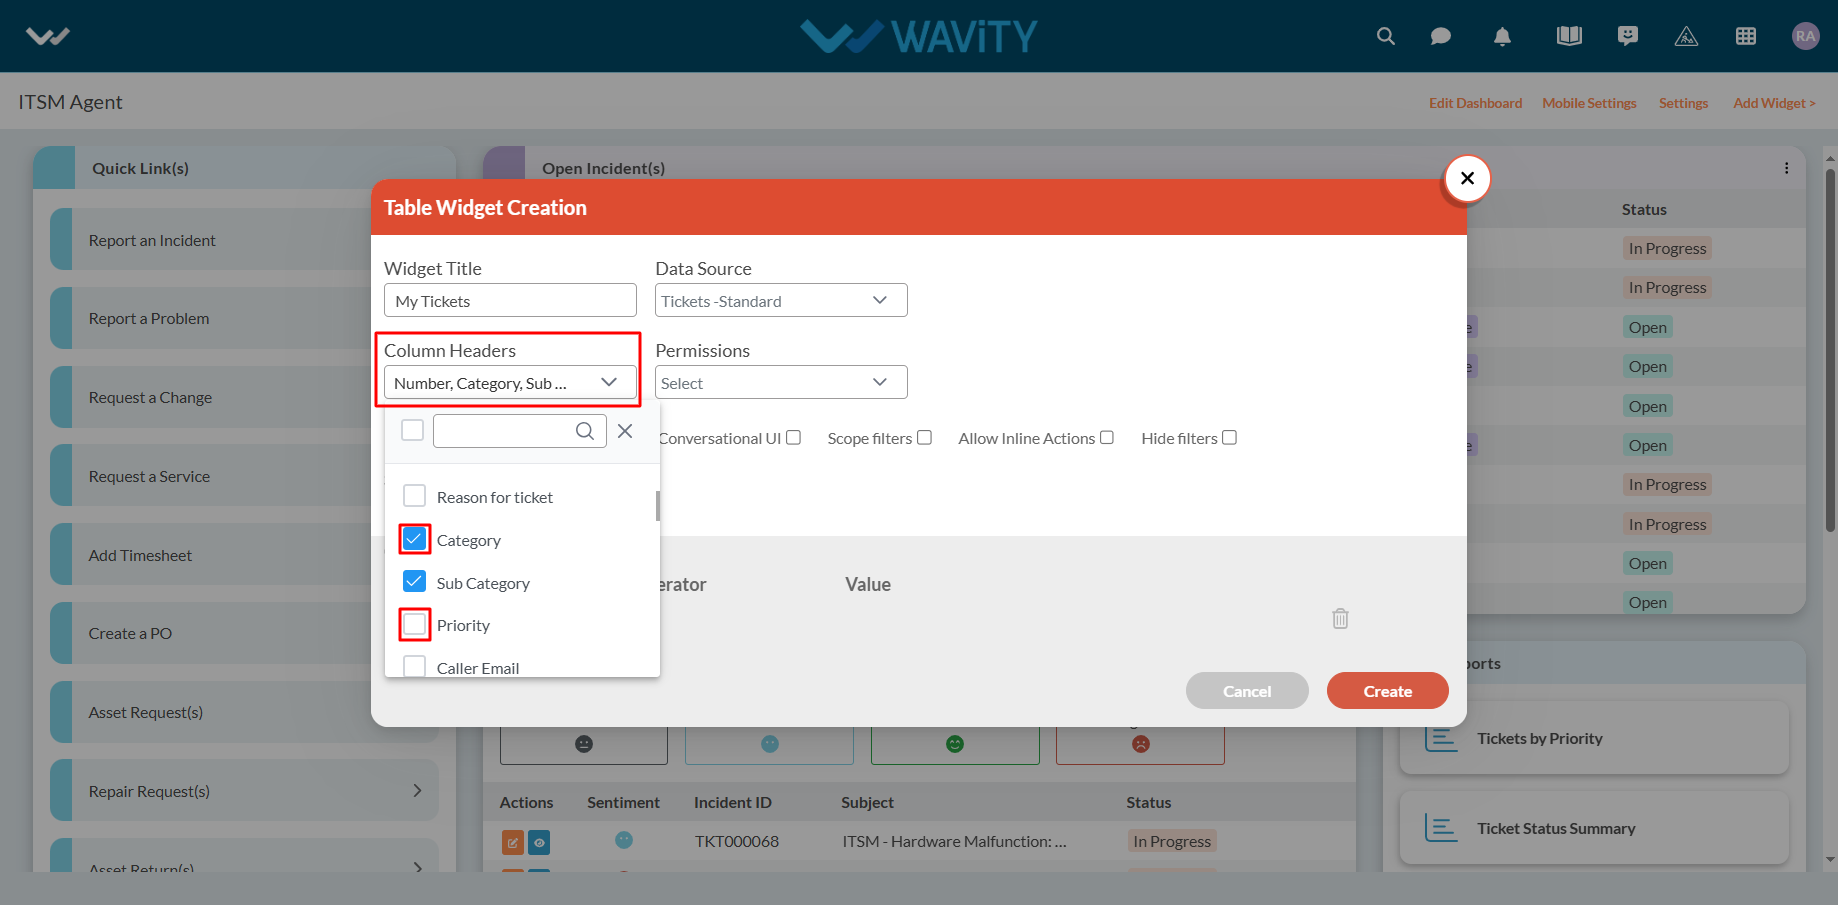
- Enter a Widget Title and choose the data source application from which the data will be fetched.

- Select the fields or headers you want to display in the table.
- Set permissions by choosing the appropriate User Category (e.g., End User, Approver, Manager, Moderator). Only users in the selected category will have access to view or edit the data, depending on the permissions defined.
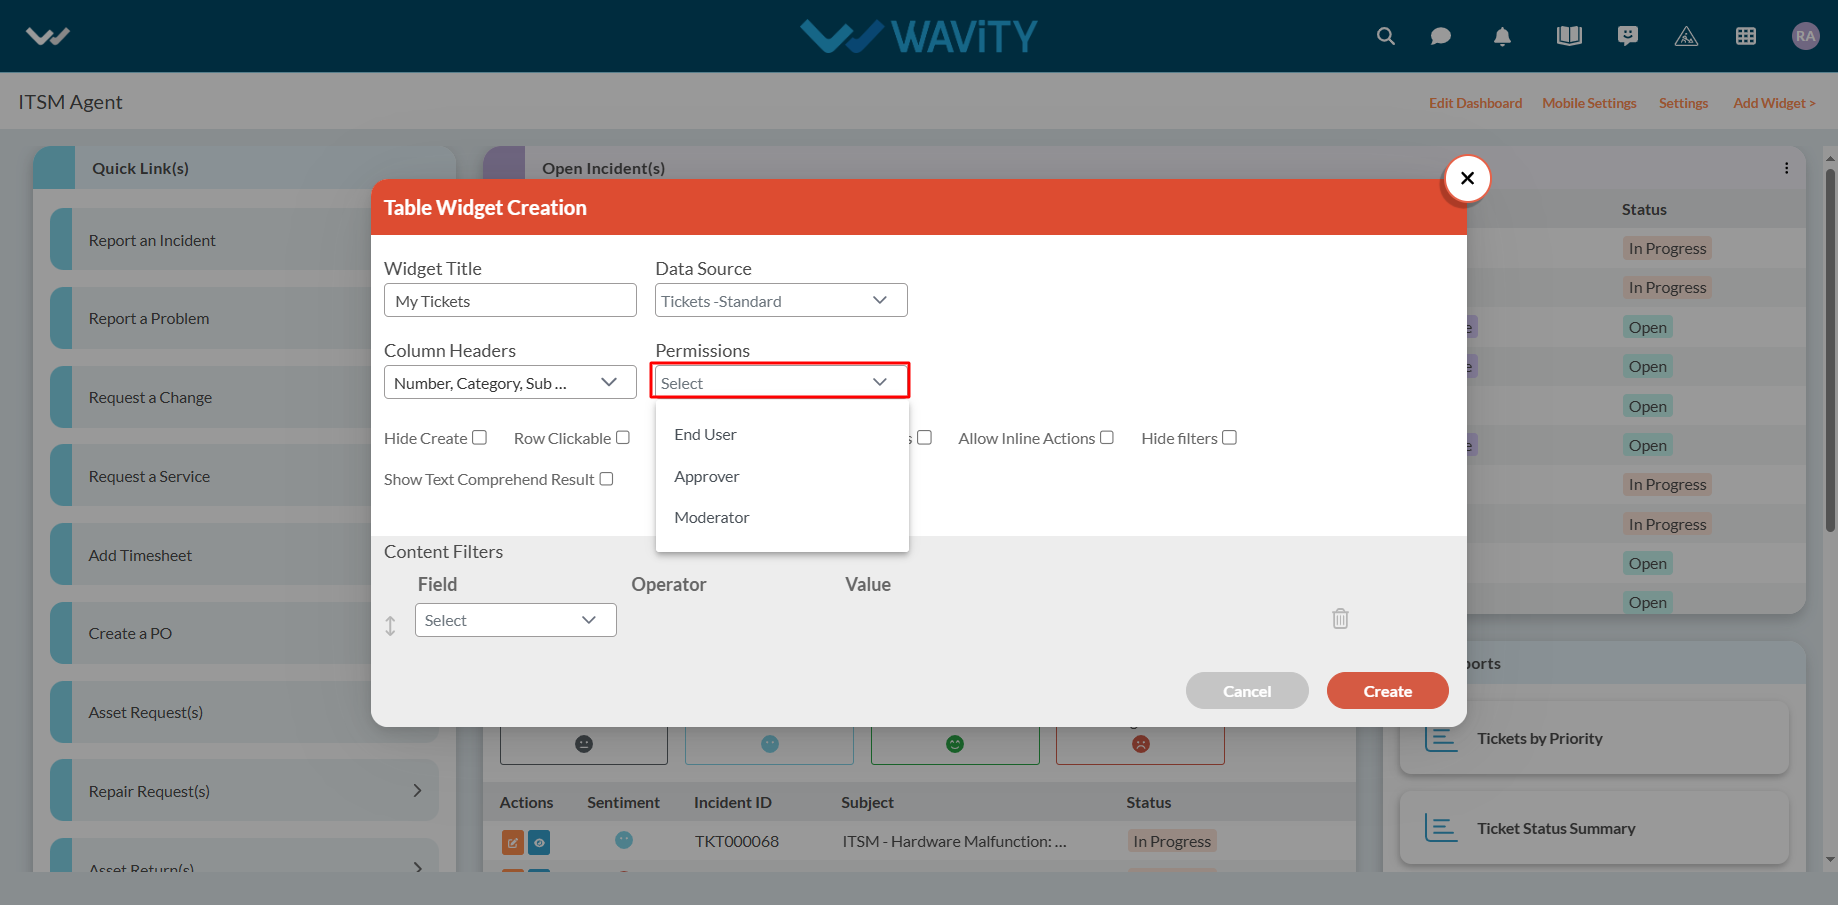
- Enable or disable available features as needed. You can also apply filters to narrow down the data displayed in the widget.
- Once all configurations are set: Click Create to generate a new Table Widget or Click Save to update an existing one.

- Here’s an example of how a Table Widget might look:
