Creating a Report Widget in Wavity
- Widgets in Wavity are interactive components or visual elements within a user interface (UI) that provide users with specific functionalities, data visualizations, or quick access to information and actions.
- Widgets can be added/edited to interfaces/dashboards in Wavity platform. This feature allows you to customize dashboards based on your requirements. For more details on creation of dashboards, please refer the following link: How To Create Role-Based Interface/Dashboards/Layouts | Wavity
- A Report Widget allows you to display clickable links of existing analytics or reports directly on your interface. To create a Report widget:
- Only an Admin of your organization has the access to create or update widgets in Wavity.
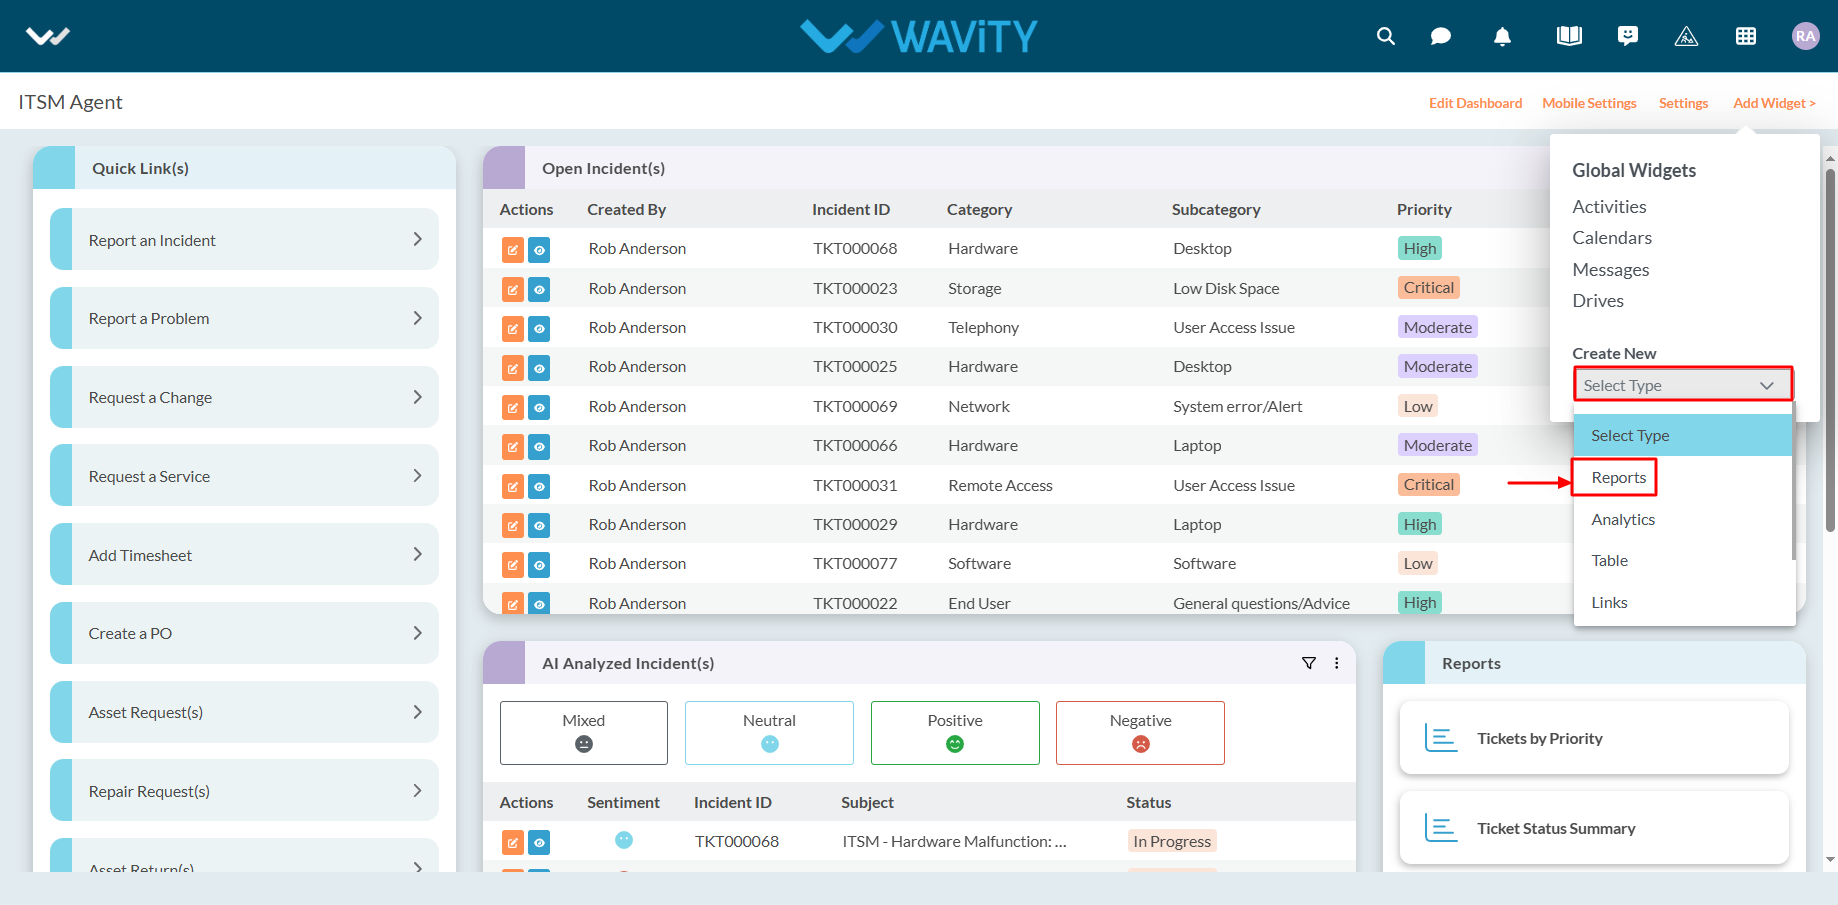
- Click on “Add Widget”, then select “Reports” from the Create New dropdown menu.
- Provide the widget title.

- Provide a Reports Title—this is the clickable text users will see in the interface.
- Choose the Source Application of existing analytics from which the widget will display those analytics
- Choose the User Category (e.g., End User, Approver, Manager, Moderator) to define who can view or interact with the Link Widget. Permissions are based on the selected data source application.
- Once all configurations are set: Click Create to generate a new Reports Widget or Click Save to update an existing one.

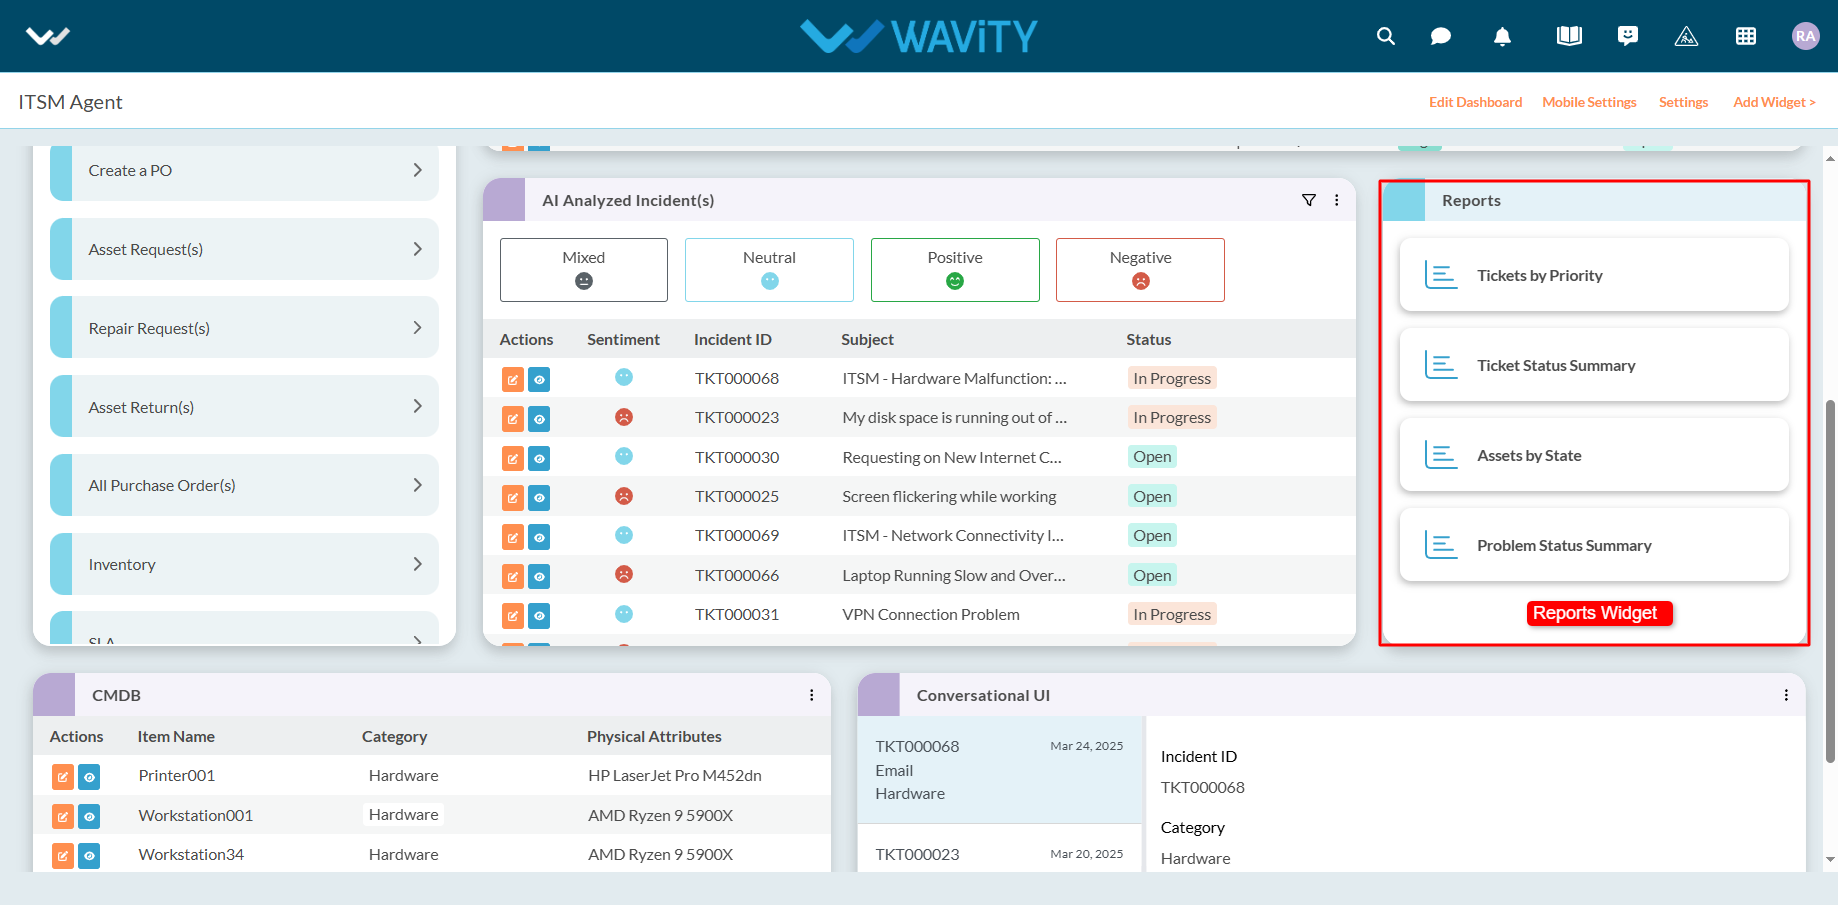
- Here is an example of how the reports widget will look like in the interface.