Built-In Analytics And Reports In IT Asset Management
Built-In Analytics and Reports in IT Asset Management
Analytics and Reports are available in all dashboards.
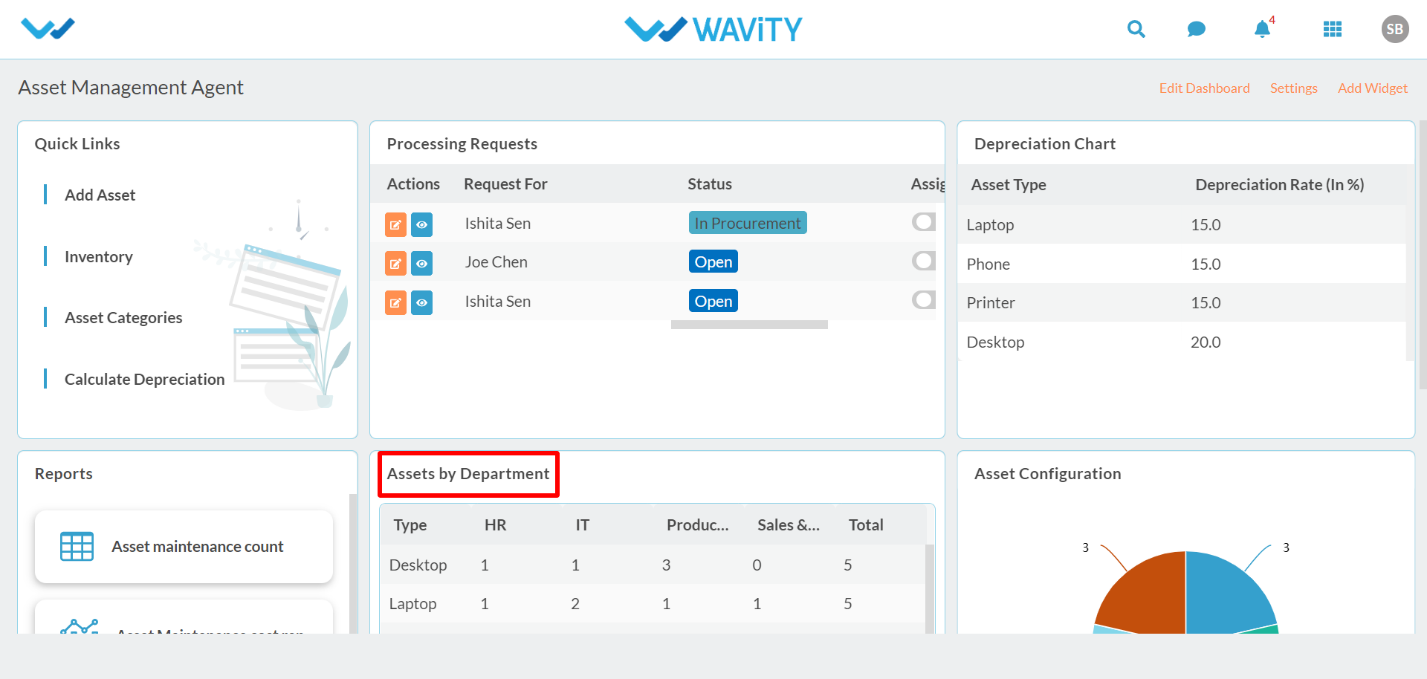
For Agents, click on “Assets by department table widget to view count of assets categorized department wise.
It will display count of assets categorized department wise in table format. Similar table widget can be configured for location wise categorization. You can export the data to excel sheet as shown below.
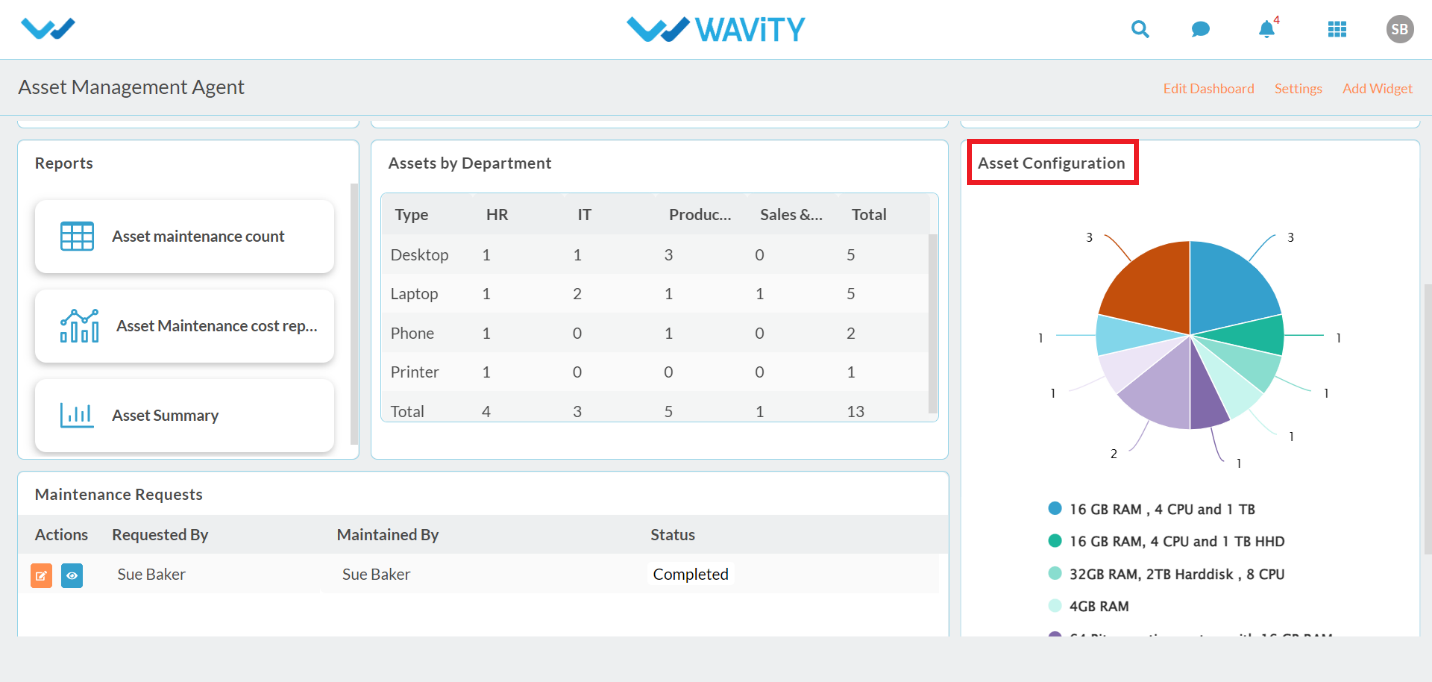
Click on “Asset Configuration” analytics widget.
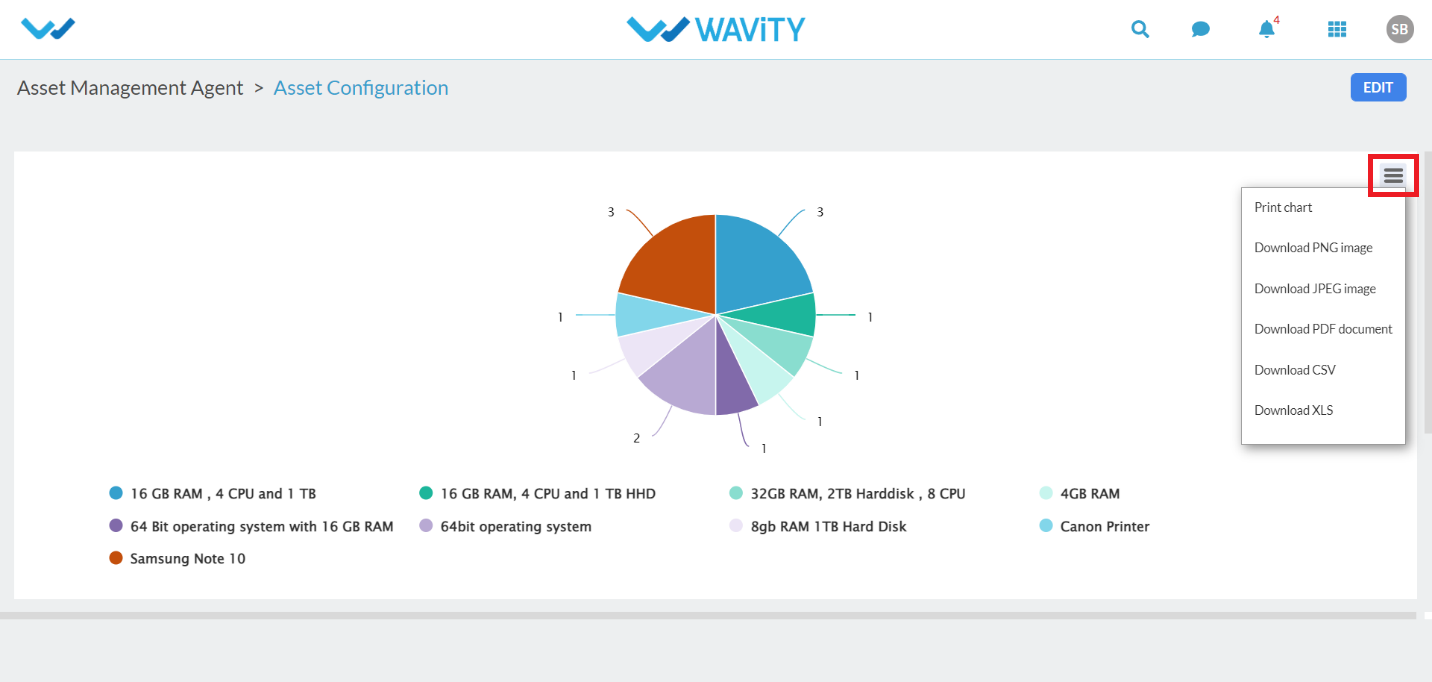
It will display Asset Configuration in a Pie Chart format. All the Analytics widget can be printed and downloaded in different formats as shown below.
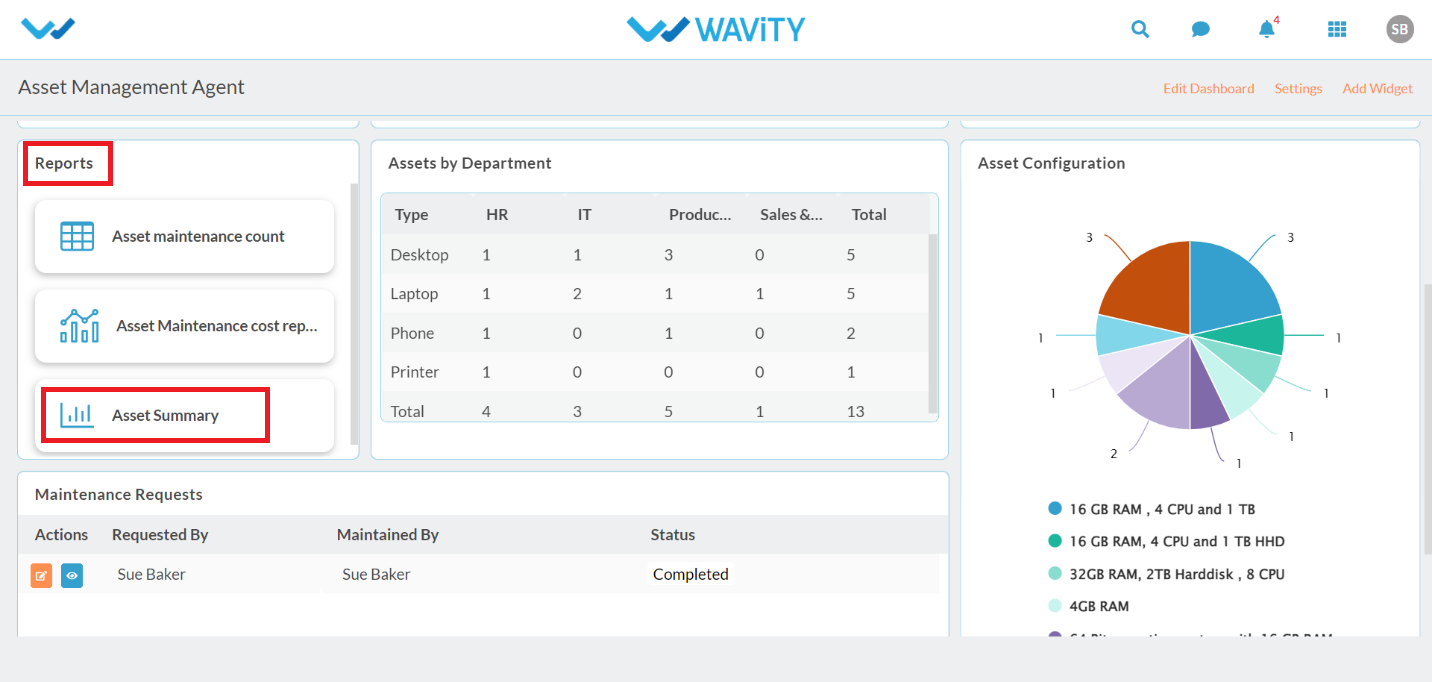
Click on “Asset Summary” under reports as shown below.
It will display Asset quantity based on configuration, asset location, type of Assets and Asset State. Click on Asset Location (Green bar).
Quantity of Assets based on locations will be displayed as shown below.
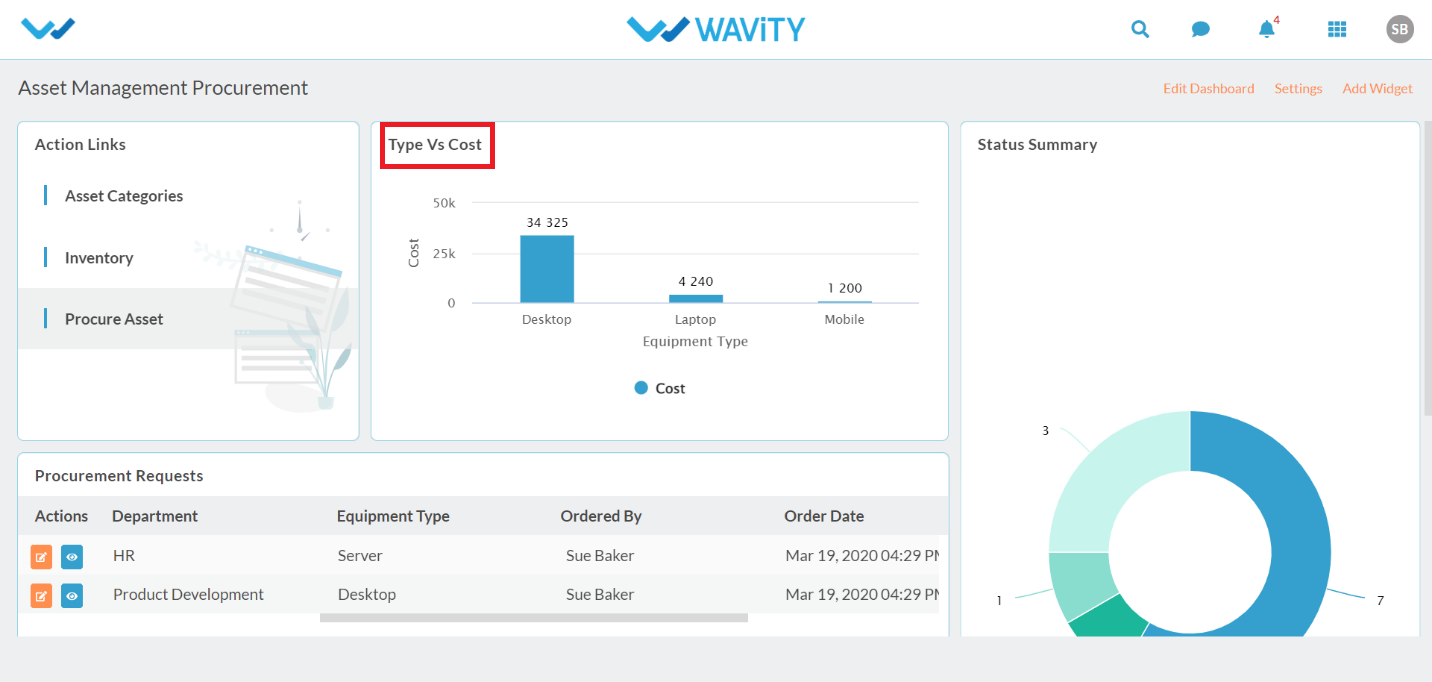
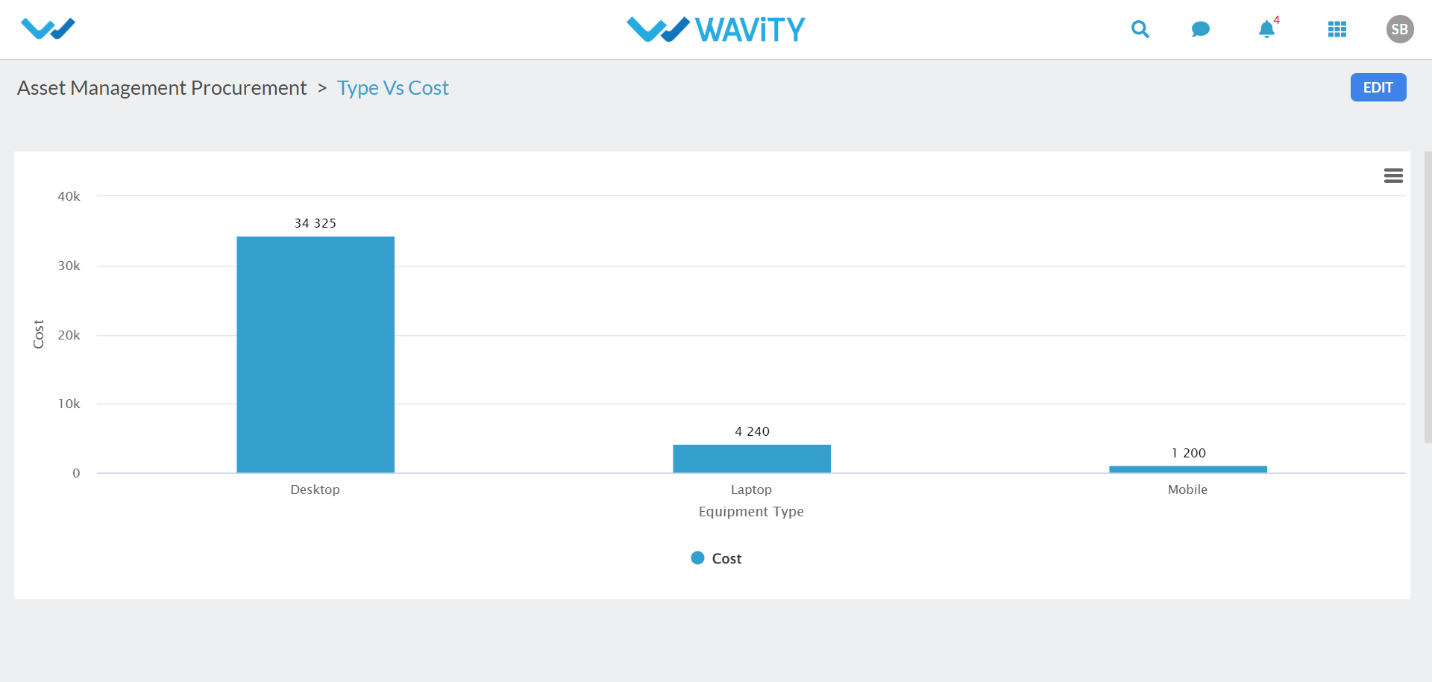
For procurement team, Click on “Type vs Cost’ Analytical widget in Procurement dashboard.
It will display “type vs cost” analytics of the asset in bar format. Similar analytics can be configure based on weekly or monthly data.