Analytics and Reporting Solutions contain actionable data visualizations that help you improve your business processes and practices.
Use the Report and Analytics widgets on the dashboard to visualize data over time, analyze your business processes, and identify areas of improvement.
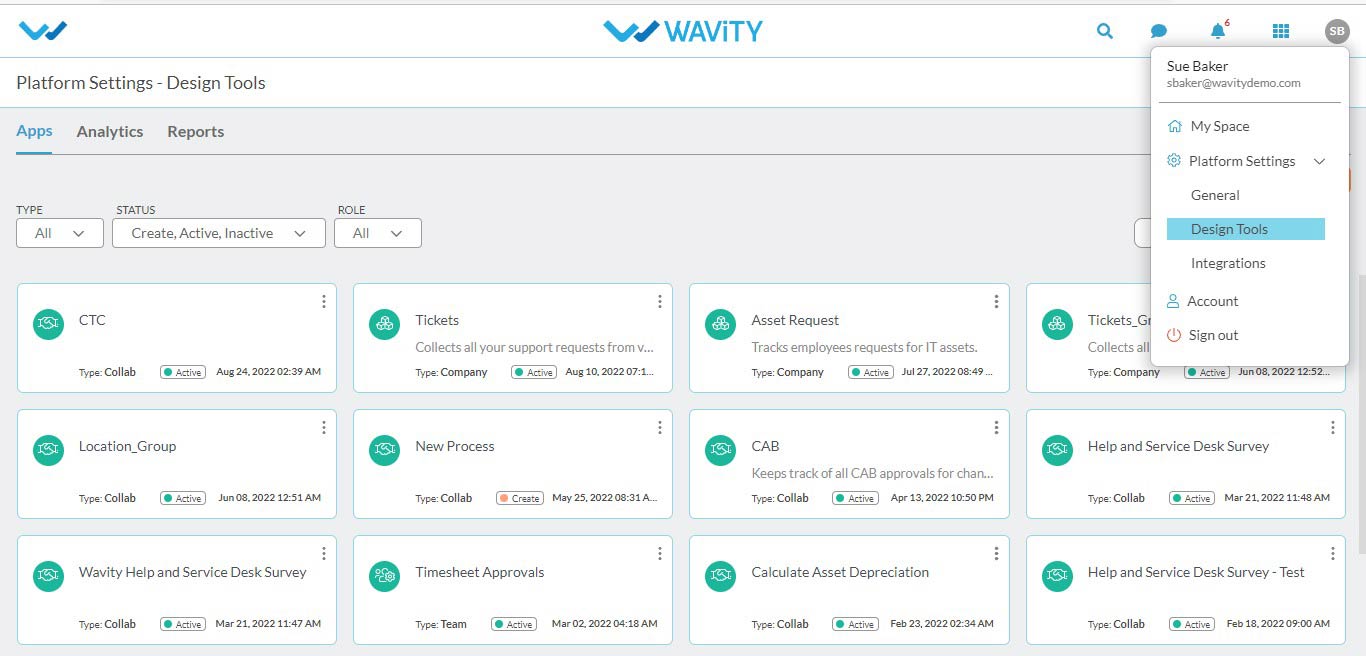
Analytics and reports can be viewed through the admin account. Navigate to profile>Design tools.
click on Analytics to view all the reports.
Use the analytics and reports in dashboard to view, maintain, and track the tasks and tickets for operating the IT service desk.
The IT ticketing dashboards lets you see recent trends in ticket creation, duration, and resolution. Use the information on this dashboard to spot problem areas and plan your help desk service management strategy going forward.
View the last month,previous month,current month/week/day/year of tickets. Filter the count by assignment groups or by the category of tickets.
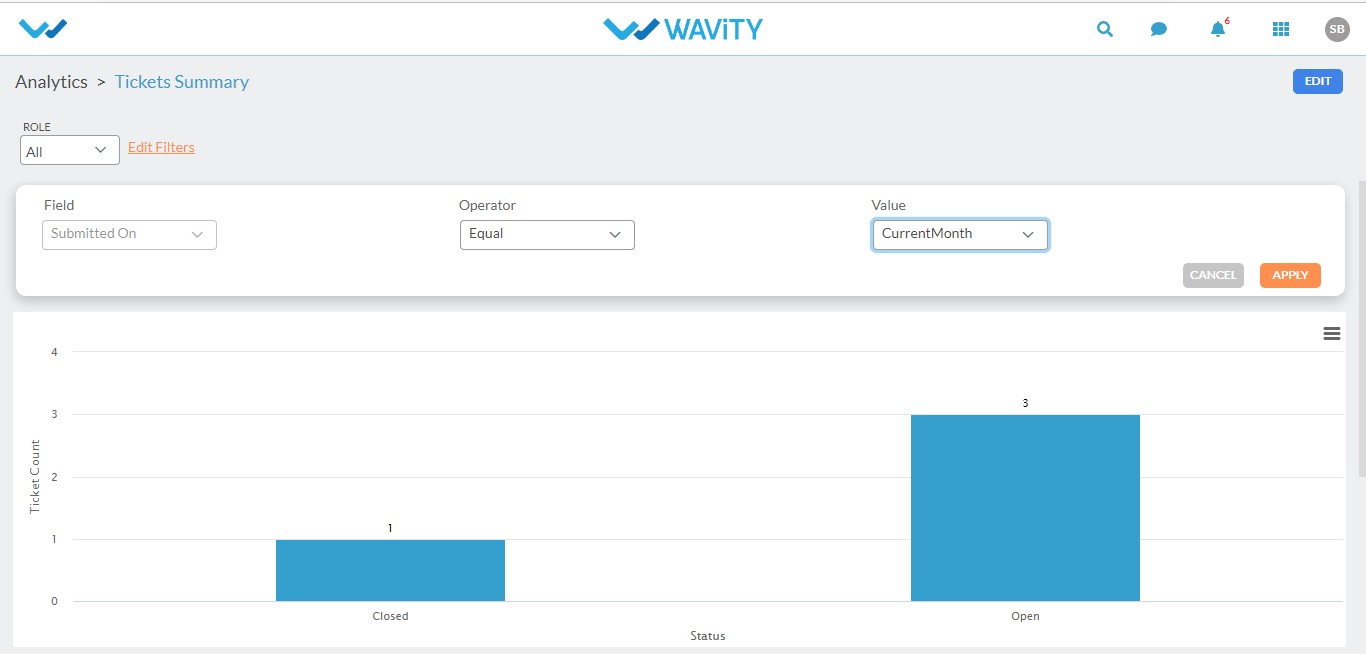
View the current information about open tickets as a list, or as a different kinds of chart(pie,line,column,bar,pie_donut) or a table format organized by breakdown.